Our system will evaluate the answer based on this AI-generated description.
The image contains two graphs. The first graph, a line graph, displays the world population from 1800 to 2100 in billions, with points marked at 1800 (approximately 1 billion), 1900 (approximately 1.6 billion), 1950 (approximately 2.5 billion), 2000 (approximately 6 billion), 2050 (around 9 billion), and 2100 (a decline to about 7 billion). The second graph, a bar graph, shows the world urban population in billions, split into developed and developing regions from 2005 to 2030, with values for developed regions in 2005 (approximately 0.9 billion), 2010 (approximately 1 billion), 2015 (approximately 1.1 billion), 2020 (approximately 1.2 billion), 2025 (approximately 1.3 billion), 2030 (approximately 1.4 billion); and for developing regions in 2005 (approximately 1.8 billion), 2010 (approximately 2.2 billion), 2015 (approximately 2.6 billion), 2020 (approximately 3 billion), 2025 (approximately 3.4 billion), 2030 (approximately 3.8 billion).
Given the complexity of the image, the above description may not be entirely accurate.
Skyrocket your IELTS band score by 1-2 points in under a month with our premium plan!
Note: Both the topic and the answer were created by one of our users.
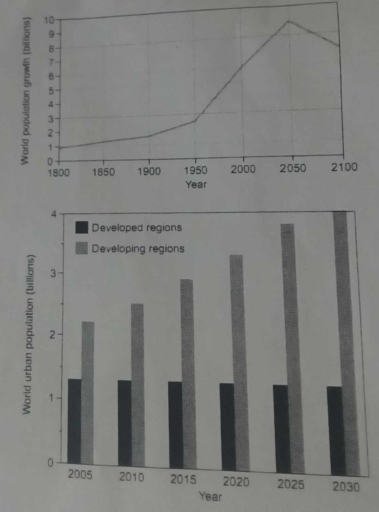
The first curve graph shows information about global population figure and the bar chat presents urban population in developed and developing regions.
Overall, the world population is forecast to experience a gradual increase and a sharp decline. Furthermore, while in developing areas the population will increase while the developed areas will remain constant.
According to the data provided in the first graph, the world population was around 1,000 in the year of 1800, afterwards it experienced a slight increase and arrived at 2,000 in 1920. However, it started to climb dramatically since 1940 and this tendency is predicted to continue until the figure will hit its record high at 8,000 in 2040. Then the world population will decline sharply.
We could know from the second graph that urban population in developed regions will remain stable, between 1,000 to 1,500 from 2015 to 2040. On the other hand, the situation in developing countries will be totally different: urban population will be about 2,100 in 2015, then it will witness a gradual rise and reach at 4,000 in 2040 which will be almost two times as much as in 2015.
Word Count: 188