Our system will evaluate the answer based on this AI-generated description.
The image displays two line graphs with percentage data from 1980 to 2040. The first graph shows data for Males (%) and Females (%). For Males (%), the approximate percentage values are: 1980-12, 1985-14, 1990-14, 1995-13, 2000-18, 2005-13, 2010-14, 2015-12, 2020-13, 2025-17, 2030-29, 2035-34, 2040-34. For Females (%), the values are: 1980-39, 1985-43, 1990-45, 1995-32, 2000-32, 2005-52, 2010-42, 2015-42, 2020-44, 2025-43, 2030-42, 2035-41, 2040-43. The second graph presents data for three age categories. For 21-25 years old (%), the values are: 1980-45, 1985-43, 1990-34, 1995-54, 2000-34, 2005-54, 2010-43, 2015-43, 2020-41, 2025-48, 2030-55, 2035-57, 2040-56. For 25-30 years old (%), the values are: 1980-32, 1985-33, 1990-32, 1995-34, 2000-31, 2005-30, 2010-29, 2015-28, 2020-29, 2025-31, 2030-35, 2035-41, 2040-43. For >30 years old (%), the values are: 1980-9, 1985-15, 1990-13, 1995-14, 2000-23, 2005-19, 2010-17, 2015-18, 2020-19, 2025-18, 2030-24, 2035-29, 2040-32.
Given the complexity of the image, the above description may not be entirely accurate.
Skyrocket your IELTS band score by 1-2 points in under a month with our premium plan!
Note: Both the topic and the answer were created by one of our users.
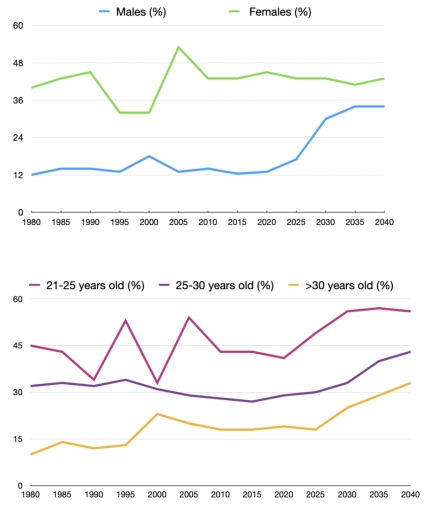
The line graphs show unemployment rates for men and women, and for different age groups, in Australia from 1980 to 2040.
Overall, women had higher unemployment rates than men during the whole period. Also, younger people were more affected by unemployment than older age groups. Although the figures changed over time, most groups experienced an increase towards the end of the period.
Male unemployment was about 12% in 1980 and changed only slightly until around 2020. After that, it increased quickly and reached about 35% in 2040. In comparison, female unemployment started at around 40% and rose to over 50% in 2005. It then fell slightly but remained high, finishing at approximately 42%.
Looking at age groups, people aged 21-25 had the highest unemployment rates. Their figures fluctuated a lot, between about 30% and 55%, and ended at nearly 58% in 2040. Unemployment among those aged 25-30 decreased a little at first, then rose to around 44% by the end. People over 30 had the lowest rates throughout the period, although their unemployment also increased gradually from about 12% to just over 30%.
Word Count: 183