Our system will evaluate the answer based on this AI-generated description.
The image displays a bar chart with energy generated by wind in four countries from 1985 to 2000 measured in Gigawatts; from left to right, each set of bars represents the years 1985, 1990, 1995, and 2000 for four unlabelled countries. Country 1 started with 5 GW in 1985, increasing to nearly 7 GW in 1990, approximately 6 GW in 1995, and roughly 8 GW in 2000; Country 2 began with almost 4 GW in 1985, rising to 5 GW in 1990, approximately 10 GW in 1995, and about 16 GW in 2000; Country 3 had around 3 GW in 1985, marginally above 9 GW in 1990, near 7 GW in 1995, and close to 5 GW in 2000; Country 4 started with almost 1 GW in 1985, just over 3 GW in 1990, approximately 5 GW in 1995, and slightly over 11 GW in 2000. The vertical axis scales from 0 to 20 with marked intervals every 5 GW, while horizontal axis lists the four years equally spaced.
Given the complexity of the image, the above description may not be entirely accurate.
Skyrocket your IELTS band score by 1-2 points in under a month with our premium plan!
Note: Both the topic and the answer were created by one of our users.
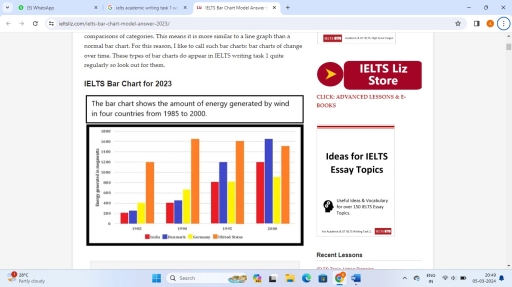
The given bar graph illustrates the wind energy generation in four distinct countries (India, Denmark, Germany and United States) from the year 1985 to 2000. It is evident from the graph that there has been energy surge each year in every country.
The vertical axis represents the amount of energy in units, while the horizontal axis denotes the years. Over a period of 15 years from 1985 to 2008, Denmark showed drastic and steady grown in the energy generation. Though US produced the most wind energy throughout the years except the 2000, the graph doesn’t depict a major increase in the energy generation.
Germany elucidates upward trajectory over the 15-year span. This indicates their positive growth in harnessing power.
Focusing specifically to India’s wind energy generation during the timeframe, it can be observed that the values fluctuated starting the 20 units in the year 1985, followed by increase of 400 units in 1990. Subsequently there was a substantial leap to 1200, reaching its peak at 1200.
Notably each country exhibited unique patterns of growth and development in harnessing wind power.
Word Count: 180