Our system will evaluate the answer based on this AI-generated description.
The image is a bar graph displaying carbon emissions from three fossil fuels (Gas, Oil, Coal) in the UK over four five-year intervals (1990, 1995, 2000, 2005, 2010). In 1990, Gas emissions were approximately 225 million tons, Oil approximately 75 million tons, and Coal approximately 200 million tons. In 1995, Gas emissions increased to around 275 million tons, Oil decreased to approximately 50 million tons, and Coal remained consistent at 200 million tons. In 2000, Gas emissions remained at 275 million tons, Oil decreased further to approximately 25 million tons, and Coal reduced to approximately 150 million tons. In 2005, Gas emissions decreased to around 225 million tons, Oil maintained at approximately 25 million tons, and Coal increased to approximately 175 million tons. In 2010, Gas emissions further decreased to approximately 175 million tons, Oil remained at approximately 25 million tons, and Coal reduced to around 150 million tons.
Given the complexity of the image, the above description may not be entirely accurate.
Skyrocket your IELTS band score by 1-2 points in under a month with our premium plan!
Note: Both the topic and the answer were created by one of our users.
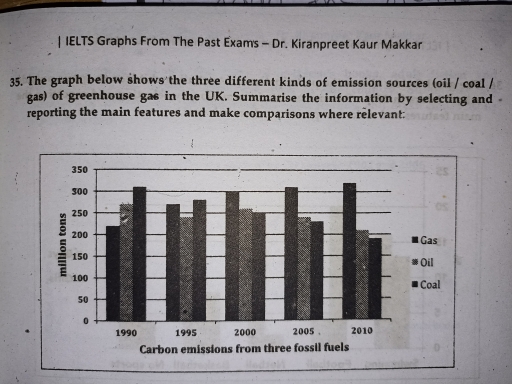
The given bar graph compares the emission of greenhouse gas in millions of tons from three different kinds of sources namely oil, coal, gas in the UK from 1990 to 2010.
In 1990, the greenhouse gas emission gas stood at 220 millions tons. After five year’s the number of gas increased with 270 million tons. To 2010, the emission of gas was slightly jump to reached at 320 million tons respectively.In 1990, the emission of oil which stood at 270 million tons. After few years there was sharply depressed here with 240 million tors in 1995 ond in 2000 the number of oil was up with 260 million tons. To 2010 the emission of oil number showed a fluctuations and last year the number reached at 210 millon tons.
On the other hand, the coal source of the greenhouse which is highest number of emission in 1995 with 310 millon tons respectively. In 1995, the rate was slightly down with 280 millon tons. After that the number of emissions day by day slowly went down from 2000 to 2020 to reach at 190 millon tons.
Overall we can see that, the remission of gas which showed a upward trend and showed downward trend, where the emissions of oil which is ultimate fluctuated here.
Word Count: 213