🔥 Today Only: Save 30% on Premium — Offer Ends Soon! - Upgrade Now!
Bar Chart

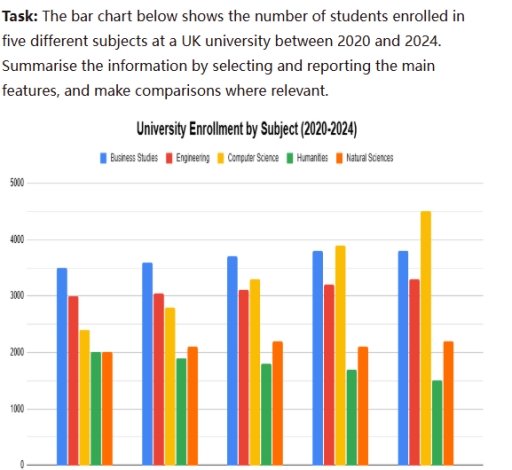
Band 4+: the bar chart below shows the number of students enrolled in five different subjects at a UK university between 2020 and 2024. Summarise the information by selecting and reporting the main features, and make comparisons where relevant

Image for topic: the bar chart below shows the number of students enrolled in five different subjects at a UK university between 2020 and 2024. Summarise the information by selecting and reporting the main features, and make comparisons where relevant
Our system will evaluate the answer based on this AI-generated description.
The image displays a bar chart titled 'University Enrollment by Subject (2020-2024)' showing student numbers for five subjects over five consecutive years. In the first year, enrollments were: Business Studies 3500, Engineering 3000, Computer Science 2400, Humanities 2000, and Natural Sciences 2000. In the second year: Business Studies approximately 3600, Engineering approximately 3050, Computer Science approximately 2800, Humanities approximately 1900, and Natural Sciences approximately 2100. In the third year: Business Studies approximately 3700, Engineering approximately 3100, Computer Science approximately 3300, Humanities approximately 1800, and Natural Sciences approximately 2200. In the fourth year: Business Studies approximately 3800, Engineering approximately 3200, Computer Science approximately 3900, Humanities approximately 1700, and Natural Sciences approximately 2100. In the fifth year: Business Studies approximately 3800, Engineering approximately 3300, Computer Science 4500, Humanities 1500, and Natural Sciences approximately 2200.
Given the complexity of the image, the above description may not be entirely accurate.
Note: Both the topic and the answer were created by one of our users.

The given bar charts illustrates, the number of students who enrolled in five different courses at a United Kingdom between 2020 and 2024.

Overall, the larger number of students studied computer science coures than Humanities. While the highest number of students took Business studies and Engineering course respectively, natrual science was taken by the smallest number of coures.

In respect of computer science , almost 4500 students studied course as opposed to roughly 3900 students. In the same way , more students approximately 3200 took business course than engineering just over 3000. In Humanities , meanwhile the number of students was around 2000 which was barely slower than that of Engineering.

On the other hand , the number of students in Business studies and natrual science at UK meanwhile , were greater than those who studied same courses .Similarly the number of natrual science just over 2000, meanwhile the ranges of the number of students in the remaining courses were approximately 2000,2100,2200.

Word Count: 162

Answers On The Same Topic:

the bar chart below shows the number of students enrolled in five different subjects at a UK university between 2020 and 2024. Summarise the information by selecting and reporting the main features, and make comparisons where relevant

The given bar chart illustrates the amount of students got into UK university in five different classes in period started in 2020 and ended in 2024. Overall, while almost all subjects were constant, without seemed changes, only computer science showed the stable big increases. At the beginning of the period, business was the most popular […]

the bar chart below shows the number of students enrolled in five different subjects at a UK university between 2020 and 2024. Summarise the information by selecting and reporting the main features, and make comparisons where relevant

The bar chart illustrates how many students enrolled to the UK’s university in five different subjects, namely business studies, engineering, computer science, humaties and natural sciences, from 2020 to 2024. Overall, it can be seen that computer science shows a gradual increase over the period, while humanities decreased stedly to 2024. In comparison, other subjects […]

the bar chart below shows the number of students enrolled in five different subjects at a UK university between 2020 and 2024. Summarise the information by selecting and reporting the main features, and make comparisons where relevant

The provided bar chart illustrates enrollment of students in five different distincts at a certain university in UK, over a 4 year period from 2020 to 2024, measured in numbers. Overall, the number of students enrolled in buisness, computer science and engineering have increased thorough the period, while humanities displayed an annual decline. Natural sciences […]

the bar chart below shows the number of students enrolled in five different subjects at a UK university between 2020 and 2024. Summarise the information by selecting and reporting the main features, and make comparisons where relevant

The given chart presents the enrollment figures for five distinct subjects at a certain UK university over a five-year period from 2020 to 2024. Overall, an upward trend could be seen in business studies, engineering, and computer science, while humanities exhibited an annual decline. Natural science displayed moderate fluctuations over the whole recorded course. In […]

See All

Other Topics:

The bar chart compares the percentages of men and women in a town who participated in four leisure activities in 2025. Respondents could select more than one activity.

The bar chart compares male and female participation rates in four leisure activitiesin a town in 2025. People could report taking part in more than one activity. Overall, swimming had the highest participation rate among both men and women. Women recorded higher figures for swimming and yoga, while men were more likely to participate in […]

The chart below shows the level of carbon emissions of three types of fossil fuel in the United Kingdom from 1990 to 2010.

The bar chart shows the tons of carbon emissions from three fossil fuels, as well as gas, oil and coal in the United Kingdom from 1990 to 2010. It is clear that, while the level of carbon emissions from three types of fossil fuel especially oil and coal in United Kingdom increased noticeably. Moreover, gas […]

The chart below compare the number of people per household* in the UK in 1981 and 2001.

The bar chart illustrates the proportions of UK households consisting of different numbers of people in 1981 and 2001. Overall, two-person households accounted for the largest proportion in both years, while six-person households had the smallest share in 2001. Another considrable feature is that smaller households became increasingly common over the period, whereas the proportion […]

The chart below compare the number of people per household* in the UK in 1981 and 2001. Summarize the information by selecting and reporting the main features, and make comparisons where relevant.

The graphs compare the number of household members in the United Kingdom over the 20-year period, starting from 1981. Overall, the given charts highlight significant variations in the number of household members throughout the period, where couple units recorded the highest numbers in both years, while 6-person experienced the lowest. In 1981, 2-person households was […]

The chart shows the average consumption of soft drinks and bottled water per person in five countries in 2002.

The bar chart illustrates the average consumption of two kinds of beverages, soft drinks and bottled water in five countries in 2002, with figures expressed in liters per person. Overall, the United States recorded the highest figure of soft drinks, as well as each people in Germany consumed the most bottled water among five countries. […]

See All
We have detected unusual activity on your device.
Please verify your identity to continue.
Note: This verification step won't sign you in. If you have a premium account, please log in to access the service as usual.
Google/Gmail Verification
Or verify using Email/Code
We've sent a verification code to:
youremail@gmail.com (Not your email?)
Enter it below to complete the verification process.
Ensure your email address is correct, your inbox is not full, and you check your spam folder. If no email arrives, consider using an alternative email.
You will need a Premium plan to perform your action!
Note: If you already have a premium account, please log in to access our services as usual.

Plans & Pricing

Our mission is to make quality education accessible for everyone.
However, to keep our hardworking team running and this service alive, we genuinely need your support!
By opting for a premium plan, not only do you sustain us in achieving the mission, but you also unlock advanced features to enrich your learning experience.

Free

For learners who aren't pressed for time

What's included on Free
100+ Cambridge IELTS Tests
Instant IELTS Writing Task 1 & 2 Evaluation (2 times/month)
Instant IELTS Speaking Part 1, 2, & 3 Evaluation (2 times/month)
Instant IELTS Writing Task 1 & 2 Essay Generator (2 times/month)
500+ Dictation & Shadowing Exercises
100+ Pronunciation Exercises
Flashcards
Other Advanced Tools

Premium

For those serious about advancing their English proficiency, and for IELTS candidates aspiring to boost their band score by 1-2 points (especially in writing & speaking) in just 30 days or less

What's included on Premium
Save Your IELTS Test Progress & Analyze Mistakes By Question Type
Save Your Own Flashcard Sets & Use Them On Any Device
Unlock All Courses, IELTS Tests, Section & Part Practice
Unlimited AI Conversations
Unlimited AI Writing Enhancement Exercises
Unlimited IELTS Writing Task 1 & 2 Evaluation
Unlimited IELTS Speaking Part 1, 2, & 3 Evaluation
Checked Answers Will Not Be Published
Unlimited IELTS Writing Task 1 & 2 Essay Generator
Unlimited IELTS Speaking Part 1, 2, & 3 Sample Generator
Unlimited Usage Of Advanced Tools & AI Features
Priority Support within 24h (12-month plan only)

Due to the nature of our service and the provided free trials, payments are non-refundable.