🔥 Today Only: Save 30% on Premium — Offer Ends Soon! - Upgrade Now!
Multiple Graphs

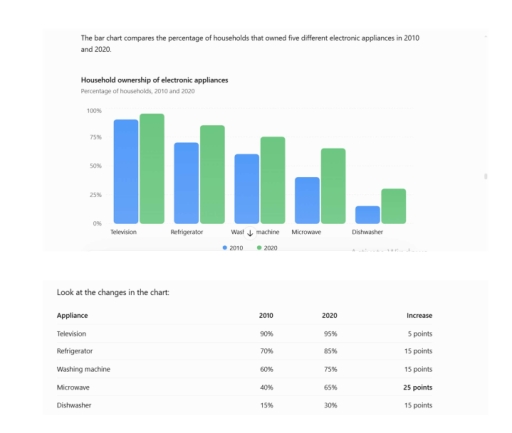
Band 7+: The bar chart compares the percentage of households that owned five different electronic appliances in 2010 and 2020.

Image for topic: The bar chart compares the percentage of households that owned five different electronic appliances in 2010 and 2020.
Our system will evaluate the answer based on this AI-generated description.
The image features a bar chart titled "Household ownership of electronic appliances" with subtitle "Percentage of households, 2010 and 2020", accompanied by a data table. The vertical axis of the bar chart measures percentage from 0% to 100% in increments of 25%, while the horizontal axis lists five appliances, comparing 2010 and 2020: Television, Refrigerator, Washing machine, Microwave, and Dishwasher. The corresponding table lists columns "Appliance", "2010", "2020", and "Increase" with the exact values: Television at 90% (2010), 95% (2020), with a 5 points increase; Refrigerator at 70% (2010), 85% (2020), with a 15 points increase; Washing machine at 60% (2010), 75% (2020), with a 15 points increase; Microwave at 40% (2010), 65% (2020), with a 25 points increase; and Dishwasher at 15% (2010), 30% (2020), with a 15 points increase.
Given the complexity of the image, the above description may not be entirely accurate.
Note: Both the topic and the answer were created by one of our users.

The bar chart shows the percentages of households that owned five different electronic appliances, namely televisions, refrigerators, washing machines, microwaves and dishwashers in 2010 and 2020.

Overall, households ownership rates of all five electronic appliances were higher in 2020 than 2010. Televisions were the highest owned electronic appliance in both 2010 and 2020. Refrigerators, washing machines, and microwaves holds the next three positions, respectively. Dishwashers had the lowest ownership rates in both 2010 and 2020.

Televisions ownership rates increased by 5 percentage points from 90% in 2010 to 95% in 2020. The ownership rates of both refrigerators and washing machines increased from 70% to 85% and 60% to 75%, respectively. Microwave experienced the highest change of ownership rates rising by 25 percentage points from 40% in 2010 to 65% in 2020. Dishwashers were the least owned electronic appliance accounted for 15% and 30% ownership rates in 2010 and 2020, respectively.

Word Count: 150

Other Topics:

The graph gives information about the number of yearly visits from France and North America for holiday and business. Summarise the information by selecting and reporting the main features, and make comparisons where relevant.

The line chart illustrates the holiday and business travelling information from France and North America to UK in a research year. Overall, in the holiday visits to UK graph, there are more trips in the middle of the year, while the trip from France surpasses the visits from North America during the same period. Additionally, […]

The line graph shows the prison population in a Europian country between 1911 and 2001.

The line graphs illustrate the changes in the numbers of male and female prisoners in a European country from 1911 to 2011. Overall, the figures of the male prison population were almost 10 times bigger than those of the female prison population during the observation period. Both of them showed a decline at the beginning […]

The pie chart below shows the main sources of dietary protein for the population of the USA in 2022. The bar chart shows the primary reasons people gave for adopting a plant-based diet in the UK in the same year. Summarise the information by selecting and reporting the main features, and make comparisons where relevant.

The given pie chart provides information about the main sources of dietary protein in the USA in 2022, whereas the bar chart details the primary causes of adopting a vegetarian diet in the UK in 2022. Overall, it is evident that meat and poultry comprise the largest proportion of protein sources, while health concerns are […]

The pie chart below shows the main sources of dietary protein for the population of the USA in 2022. The bar chart shows the primary reasons people gave for adopting a plant-based diet in the UK in the same year. Summarise the information by selecting and reporting the main features, and make comparisons where relevant.

The given pie chart provides information about the main sources of dietary protein in the USA in 2022, whereas the bar chart details the primary causing of adopting a vegetarian diet in the UK in 2022. Overall, it is evident that the meat and poultry comprise the largest proportion of protein origin, while health concern […]

Dairy productin in MT - top three world producers, 2012

The bar chart shows how the proportion of dairy production in the top three producer countries changed in 2012. Overall, EU produced milk and cheese in high degrees among others, but its level is lower in butter and milk powder productions. There are 6 different countries – India, US, Brazil, New Zealand, China, and EU […]

See All
We have detected unusual activity on your device.
Please verify your identity to continue.
Note: This verification step won't sign you in. If you have a premium account, please log in to access the service as usual.
Google/Gmail Verification
Or verify using Email/Code
We've sent a verification code to:
youremail@gmail.com (Not your email?)
Enter it below to complete the verification process.
Ensure your email address is correct, your inbox is not full, and you check your spam folder. If no email arrives, consider using an alternative email.
You will need a Premium plan to perform your action!
Note: If you already have a premium account, please log in to access our services as usual.

Plans & Pricing

Our mission is to make quality education accessible for everyone.
However, to keep our hardworking team running and this service alive, we genuinely need your support!
By opting for a premium plan, not only do you sustain us in achieving the mission, but you also unlock advanced features to enrich your learning experience.

Free

For learners who aren't pressed for time

What's included on Free
100+ Cambridge IELTS Tests
Instant IELTS Writing Task 1 & 2 Evaluation (2 times/month)
Instant IELTS Speaking Part 1, 2, & 3 Evaluation (2 times/month)
Instant IELTS Writing Task 1 & 2 Essay Generator (2 times/month)
500+ Dictation & Shadowing Exercises
100+ Pronunciation Exercises
Flashcards
Other Advanced Tools

Premium

For those serious about advancing their English proficiency, and for IELTS candidates aspiring to boost their band score by 1-2 points (especially in writing & speaking) in just 30 days or less

What's included on Premium
Save Your IELTS Test Progress & Analyze Mistakes By Question Type
Save Your Own Flashcard Sets & Use Them On Any Device
Unlock All Courses, IELTS Tests, Section & Part Practice
Unlimited AI Conversations
Unlimited AI Writing Enhancement Exercises
Unlimited IELTS Writing Task 1 & 2 Evaluation
Unlimited IELTS Speaking Part 1, 2, & 3 Evaluation
Checked Answers Will Not Be Published
Unlimited IELTS Writing Task 1 & 2 Essay Generator
Unlimited IELTS Speaking Part 1, 2, & 3 Sample Generator
Unlimited Usage Of Advanced Tools & AI Features
Priority Support within 24h (12-month plan only)

Due to the nature of our service and the provided free trials, payments are non-refundable.