Our system will evaluate the answer based on this AI-generated description.
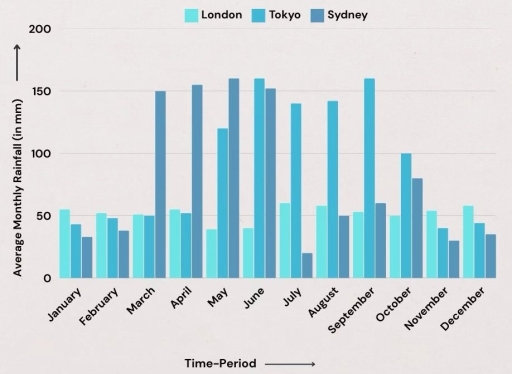
The image depicts a bar graph illustrating average monthly rainfall in millimeters: In January, London records approximately 80mm, Tokyo 50mm, Sydney slightly above 100mm; February shows London at 60mm, Tokyo just over 50mm, Sydney close to 120mm; March shows London around 60mm, Tokyo about 100mm, Sydney slightly over 130mm; April has London at roughly 50mm, Tokyo 150mm, Sydney over 100mm; May has London near 50mm, Tokyo slightly over 140mm, Sydney around 100mm; June shows London at approximately 50mm, Tokyo close to 200mm, Sydney at 130mm; July has London at 60mm, Tokyo slightly above 150mm, Sydney reaches around 90mm; August reads London slightly over 60mm, Tokyo above 150mm, Sydney approximately 70mm; September lists London at 50mm, Tokyo about 180mm, Sydney close to 55mm; October reveals London at 70mm, Tokyo approximately 160mm, Sydney slightly over 90mm; November shows London at 80mm, Tokyo 100mm, Sydney about 110mm; December displays London slightly above 70mm, Tokyo nearly 50mm, Sydney just over 75mm.
Given the complexity of the image, the above description may not be entirely accurate.
Skyrocket your IELTS band score by 1-2 points in under a month with our premium plan!
Note: Both the topic and the answer were created by one of our users.
Overall, Tokyo experiences the greatest fluctuation in rainfall, peaking dramatically in the middle of the year, whereas Sydney shows a clear downward trend. In contrast, London’s rainfall remains relatively stable throughout the twelve months.
In detail, London records modest and consistent rainfall, fluctuating slightly between about 40 and 60 millimetres each month. Tokyo, on the other hand, begins the year with moderate precipitation of around 50 mm before rainfall climbs sharply to a peak of approximately 160 mm in June. After this high point, the figure falls rapidly, reaching a similar level to that in January by December.
Sydney exhibits an opposite pattern to Tokyo. The city starts with heavy rainfall, at nearly 130 mm in January, and the amount steadily declines over the year, dropping to around 50 mm by December. Despite this decrease, rainfall in Sydney during the early months still exceeds that of both Tokyo and London.
To summarise, Tokyo is by far the wettest city with highly variable rainfall, Sydney becomes progressively drier as the year advances, while London maintains a consistently moderate level of precipitation all year round.
Word Count: 183