Our system will evaluate the answer based on this AI-generated description.
The image depicts a bar graph of frequency eating at fast-food restaurants among U.S. population aged 20 and older from 2003, 2006, and 2013. Black bars represent 2003 data, grey bars for 2006, and striped bars for 2013. The Y-axis, labeled as 'People %', ranges from 0% to 40% in 5% increments. The X-axis represents frequency of visits, labeled as 'Never', 'A few times/year', '1-3 times/month', '1-2 times/week', '3-6 times/week', and 'Every day'. The 'Never' category shows a decrease in frequency from 2003 (15%) to 2013 (8%). The 'A few times/year' category shows a slight decrease from 2003 (35%) to 2013 (33%). The '1-3 times/month' category remains consistent around 25% for all years. The '1-2 times/week' category shows a decrease from 2003 (25%) to 2013 (20%). Conversely, the '3-6 times/week' category shows an increase from 2003 (5%) to 2013 (8%). Lastly, the 'Every day' category remains consistent at 2% for all years.
Given the complexity of the image, the above description may not be entirely accurate.
Skyrocket your IELTS band score by 1-2 points in under a month with our premium plan!
Note: Both the topic and the answer were created by one of our users.
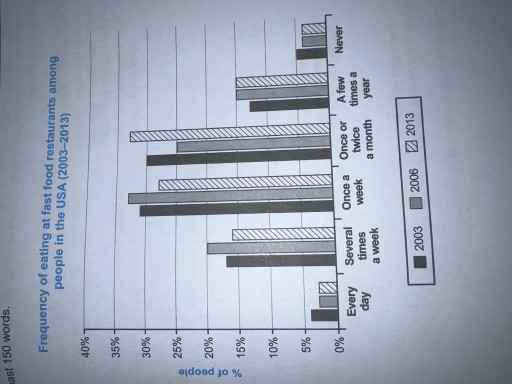
The graph clarifies fast food eaters in America from 2003 to 2013 by showing how many times people ate fast food. It is axiomatic that the percentage of all three years was more for those who had fast food once a week, or once or two times a month; but for other times, it was maximum, 20 percent.
In all three years, 2003, 2006, and 2013, less than 5 percent of the people in USA, either never went to a fast food restaurant, or it was every day. Those who had this kind of food several times a week or a year were almost the same in 2013; but in 2006, people ate fast food a few times a week more than in a year, which also holds the truth for the year 2003. The highest percentage for 2006 belongs to those with having fast food once a week, which had the same percentage for 2013, but for those who ate fast food once or two times a month.
All in all , the highest point for the year 2003 belongs to those who ate fast food once a week , which hold the truth for the year 2006 with a nuance difference in percentage ; but in 2013 , people had fast food maximum twice a month.
Word Count: 218
