Our system will evaluate the answer based on this AI-generated description.
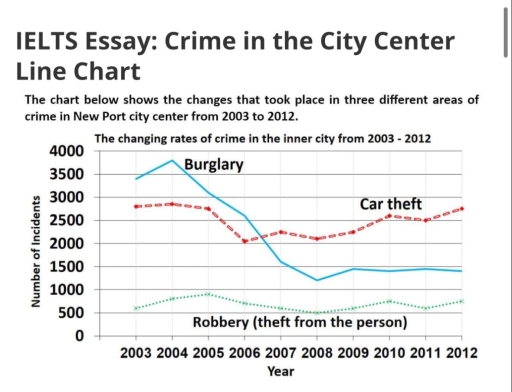
The image is a line chart titled "IELTS Essay: Crime in the City Center" showing changes in three different areas of crime in New Port city center from 2003 to 2012. Three crime categories are displayed: Burglary, Car theft, and Robbery (theft from the person), with data points for each year from 2003 to 2012. Burglary starts at roughly 3750 incidents in 2003, decreasing to about 3500 in 2004, rising to almost 3750 in 2005, then decreasing steadily to around 600 in 2012. Car theft starts at 3500 incidents in 2003, decreases to roughly 3000 in 2004, fluctuates close to 2750 from 2005 to 2007, rises slightly to 3000 in 2008, then falls steadily to around 1500 in 2012. Robbery (theft from the person) begins at just below 1000 incidents in 2003, remains stable until a rise to approximately 1200 in 2006, then falls steadily to around 200 in 2012. The horizontal axis denotes the years, with specific years marked as 2003 through 2012, while the vertical axis documents the number of incidents from 0 to 4000 in increments of 500.
Given the complexity of the image, the above description may not be entirely accurate.
Skyrocket your IELTS band score by 1-2 points in under a month with our premium plan!
Note: Both the topic and the answer were created by one of our users.
The provided line graph illustrates the changing rates of three different crimes in Newport City Center from 2003 to 2012. Overall, it is evident that burglary was the most commonly reported crime in 2003, followed by car theft and robbery, which had the least incidents.
In 2003, approximately 3,500 burglary incidents were reported, peaking in 2004 with over 3,500 incidents, making it the most frequently occurring crime at that time. However, there was a sharp decline in the number of burglary cases thereafter, with only around 1,000 incidents reported by 2008. The graph continued to fluctuate, showing that no more than 1,000 burglaries were recorded by 2012.
The data shows that the number of car theft incidents leveled off between 2003 and 2005, with roughly 3,000 cases reported before gradually declining in 2006. Subsequently, we notice significant changes, with roughly 2,000 cases filed in the following years. An upward trend is then observed, with more than 2,500 car theft cases reported by 2012.
It is clear from the graph that the number of robbery cases filed was consistently the lowest. In 2003, just over 500 robbery incidents were recorded. The graph demonstrates the fluctuations in reported robbery incidents from 2003 to 2012.
Word Count: 202
