Our system will evaluate the answer based on this AI-generated description.
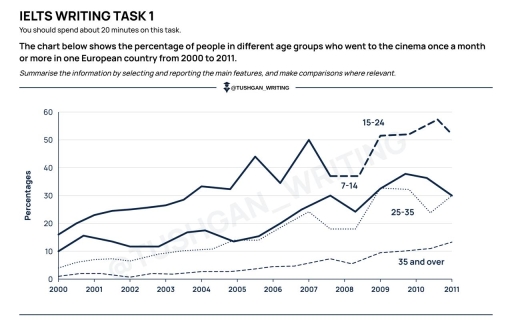
The image features a line graph with the vertical axis titled "Percentages" ranging from 0 to 60 in increments of 10, and the horizontal axis showing years from 2000 to 2011. Four age group categories are plotted: "15-24" tracks the highest values, starting as a solid line and transitioning to dashed after 2008 (2000: ~16%, 2001: ~23%, 2002: ~25%, 2003: ~26.5%, 2004: ~33%, 2005: ~32%, mid-2005: ~44%, 2006: ~34%, 2007: ~50%, mid-2007 to 2008: ~37%, 2009: ~51.5%, 2010: ~52%, mid-2010: ~57.5%, 2011: ~53%); "7-14" is a continuous solid line (2000: ~10%, 2001: ~15.5%, 2002: ~11.5%, 2003: ~12%, 2004: ~17.5%, 2005: ~13.5%, 2006: ~19%, 2007: ~26%, mid-2007: ~30%, 2008: ~24%, 2009: ~33%, 2010: ~38%, mid-2010: ~36%, 2011: ~30%); "25-35" is a dotted line (2000: ~4%, 2001: ~6.5%, 2002: ~7%, 2003: ~9%, 2004: ~10.5%, 2005: ~13.5%, 2006: ~14.5%, 2007: ~24%, mid-2007 to 2008: ~18%, 2009: ~32.5%, 2010: ~32%, mid-2010: ~24%, 2011: ~30%); and "35 and over" is a low dashed line (2000: ~1%, 2001: ~2%, 2002: ~0.5%, 2003: ~1.8%, 2004: ~2.5%, 2005: ~2.8%, 2006: ~4.5%, 2007: ~5.5%, 2007.5: ~7%, 2008: ~5.5%, 2009: ~9.5%, 2010: ~10%, mid-2010: ~11%, 2011: ~13.5%).
Given the complexity of the image, the above description may not be entirely accurate.
Skyrocket your IELTS band score by 1-2 points in under a month with our premium plan!
Note: Both the topic and the answer were created by one of our users.
The line graph compares the proportion of individuals in different age groups who attend cinema once a month or more in a European nation between 2000 and 2011. Overall, the proportion of cinema-goers increased across all four age groups over the period, although, young people led the way with the highest percentage, while it was the lowest for those aged 35 and over.
In 2000, the percentage of people aged 15 to 24 going to cinema was only about 16%, before marginally increasing at 45% over 11 years despite some fluctuations during the period. Meanwhile, teenagers aged 7 to 14 experienced the highest proportion approximately at 38% during 2010, however the figure dropped sharply to 30% by 2011. Adults aged 25 and 35 showed only 5% in 2000, before rose to 32% by 2009, but in the end of the period the figure experienced similar proportion as teenagers at 30%.
Regarding to eldest people aged over 35 remained relatively low attendance to the cinema with only 0% in the starting year, wheraes it slightly increased at 17% by 2011.
Word Count: 179
