Our system will evaluate the answer based on this AI-generated description.
The image shows a bar graph with four categories: Zoo, Library, Theatre, and Cinema, with three different groups represented: Born in Australia, New migrants born in English-speaking countries, and New migrants born in other countries. For the Zoo category, Born in Australia group is around 28%, New migrants born in English-speaking countries is around 25%, and New migrants born in other countries is around 20%. For the Library category, Born in Australia group is around 45%, New migrants born in English-speaking countries is around 40%, and New migrants born in other countries is around 35%. For the Theatre category, Born in Australia group is around 25%, New migrants born in English-speaking countries is around 15%, and New migrants born in other countries is around 10%. For the Cinema category, Born in Australia group is around 65%, New migrants born in English-speaking countries is around 48%, and New migrants born in other countries is around 55%. The graph shows that the Born in Australia group consistently has a higher percentage in all categories.
Given the complexity of the image, the above description may not be entirely accurate.
Skyrocket your IELTS band score by 1-2 points in under a month with our premium plan!
Note: Both the topic and the answer were created by one of our users.
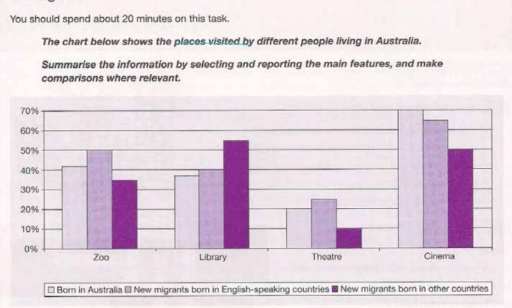
The data demonstrates the destinations that are visited by residents of Australia.
Overall, almost the most popular place for visitors of all categories is cinema. On the contrast, the least visited destination among all population is theatre. However, the biggest precent of new immigrants born in other countries visits libraries.
Cinema is considered to be the most visited place among four in the data, with the biggest amount of visiters both born in Australia and new migrants that were born in English-speaking countries (about 70% and 65%). However, it is less popular among migrants born in non-english speaking countries.
The place with the least percentage of visitors is theatre. The amount of people that were born in the country and the amount of english speaking migrants is almost the same (about 29% and 25%). However, there is a marked difference between migrants categories: the percentage of ones born in non-english countries more than two times lower than the amount of the people born in english spoken countries.
Word Count: 167
