Our system will evaluate the answer based on this AI-generated description.
The image shows a bar graph comparing coffee and tea buying and drinking habits in five Australian cities: Sydney, Melbourne, Brisbane, Adelaide, and Hobart. The y-axis represents the percentage of city residents, ranging from 0% to 70%. Each city has three bars representing the percentage of residents who bought fresh coffee, bought instant coffee, or went to a café for coffee or tea in the last four weeks. In Sydney, around 65% bought fresh coffee, 50% bought instant coffee, and 60% went to a café. In Melbourne, approximately 55% bought fresh coffee, 45% bought instant coffee, and 55% went to a café. Brisbane had around 50% for fresh coffee, 42% for instant coffee, and 38% for café visits. In Adelaide, about 45% bought fresh coffee, 38% bought instant coffee, and 40% went to a café. Lastly, Hobart had nearly 60% for fresh coffee, 40% for instant coffee, and 50% for café visits.
Given the complexity of the image, the above description may not be entirely accurate.
Skyrocket your IELTS band score by 1-2 points in under a month with our premium plan!
Note: Both the topic and the answer were created by one of our users.
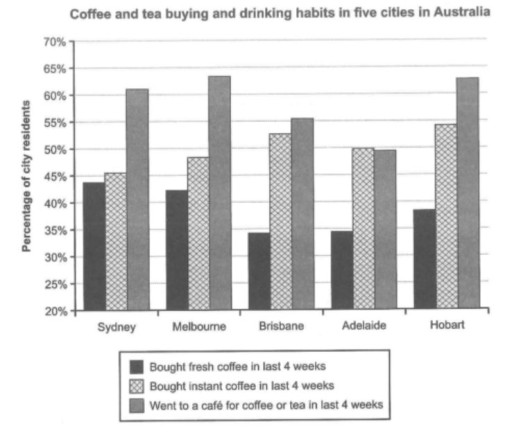
The provided chart delineates the outcomes of a survey aimed at examining the coffee and tea purchasing and consumption patterns of residents in five distinct Australian cities: Sydney, Melbourne, Brisbane, Adelaide, and Hobart.
In general, with the exception of Adelaide, the highest proportion of individuals in the past four weeks tended to frequent cafes for coffee and tea, indicating a contrasting trend compared to those who purchased fresh coffee.
Regarding cafe visits, the highest percentages were observed in Melbourne and Hobart, both surpassing 60%, marginally higher than Sydney, which stands at exactly 60%. Brisbane follows closely with over half, while Adelaide lags behind, contributing to nearly 40%.
For purchases of instant coffee, Hobart takes the lead with approximately 55%, closely trailed by Brisbane with a slightly lower percentage. The figures for the other cities fluctuate between just over 40% and 50%, with Adelaide standing out where this category constitutes the majority at exactly 50%.
As for fresh coffee purchases, Sydney and Melbourne exhibit the highest proportions, each surpassing 40%, while figures for the other cities range from around 32% to nearly 40%.
Word Count: 182
