🔥 Today Only: Save 30% on Premium — Offer Ends Soon! - Upgrade Now!
Multiple Graphs

Band 6+: The charts below give information about a public sports centre in a town called Greenford. Summarise the information by selecting and reporting the main features, and make comparisons where relevant.

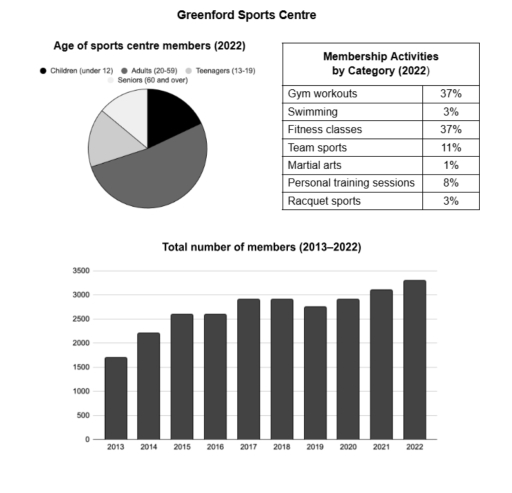
Image for topic: The charts below give information about a public sports centre in a town called Greenford. Summarise the information by selecting and reporting the main features, and make comparisons where relevant.
Our system will evaluate the answer based on this AI-generated description.
The image features data for Greenford Sports Centre consisting of a pie chart, a table, and a vertical bar chart. The pie chart, titled "Age of sports centre members (2022)", displays four unlabeled proportions with a legend indicating categories: Children (under 12), Adults (20-59), Teenagers (13-19), and Seniors (60 and over). The table, titled "Membership Activities by Category (2022)", lists activities with their respective percentages: Gym workouts at 37%, Swimming at 3%, Fitness classes at 37%, Team sports at 11%, Martial arts at 1%, Personal training sessions at 8%, and Racquet sports at 3%. The bar chart, titled "Total number of members (2013–2022)", has a vertical axis numbered from 0 to 3500 in increments of 500 and a horizontal axis spanning years from 2013 to 2022, with approximate member counts of 1700 in 2013, 2200 in 2014, 2600 in 2015, 2600 in 2016, 2900 in 2017, 2900 in 2018, 2750 in 2019, 2900 in 2020, 3100 in 2021, and 3300 in 2022.
Given the complexity of the image, the above description may not be entirely accurate.
Note: Both the topic and the answer were created by one of our users.

The charts illustrates the comparison of the number of five different age of members who participated in seven different activities at Greenford sports centre in 2022.

With reference to the table, it is readily apparent that there were both simililarity and differences among the activities. The gym workouts and fitness classes had shared the same percentage of member numbers and being the most popular activities, at approximately 37%. In contrast, martial arts was the least common activities in all seven activities, at nearly 1%.

According to the bar chart of age of sports centre members, adults between the age of 20-59 years old had the highest rates, while the children (under 12), teenagers (13-19), and seniors (60 and over) had the lowest rates.

Overall, it is of note that the gym workouts and fitness classes was likely to be what most members in all age preferred, whereas martial art was ranked the lowest among the members in Greenford sports centre.

Word Count: 160

Other Topics:

The graph below shows the average number of people attending top-level football matches in three European countries (Italy, England, and Germany) from 1980 to 2004.

The line graph illustrates the number of people attending football matches in three countries, namely Italy, England and Germany, over a 24-year period between 1980 and 2004. Overall, there was steady growth in football attendance in both Germany and England, whereas the number of spectators in Italy declined over the period. Another notable feature is […]

The pie chart and bar chart below show information about international ODI cricket series played by different countries between 2015 and 2024. Summarise the main features and make comparisons where relevant.

The pie chart illustrates the proportion of information about international ODI cricket series played by different countries, while the bar chart shows the total runs scored in international ODI series between 2015 and 2024. Overall, it is evident that India accounted for the largest proportion of percentage of both two graphics, while New Zealand had […]

The graph below shows deforestation rates in the Brazilian Amazon from 2008 to 2021 and the pie chart shows deforestation causes in the Amazon for the same years. Summarise the information by selecting and reporting the main features and make comparisons where relevant.

The graph depicts the rates of clearing forest areas in the Brazilian Amazon from 2008 to 2021, while the pie chart illustrates the reasons for deforestation in the Amazon for the same years. Admittedly, in 2008, the deforestation rate shows the biggest figure (38,000 square kilometers) here, but subsequently experienced some repeated fluctuations before going […]

WRITING TASK 1 You should spend about 20 minutes on this task. The pie chart shows average monthly student expenditure in the UK in 2016. The bar chart shows sources of student income in the same year. Summarise the information by selecting and reporting the main features and make comparisons where relevant. Write at least 150 words. Monthly student expenditures Sources of student income Recommendations Advantage Package: Get FlexCheck AI feedback on all your writing and speaking. Sing

The pie chart illustrates the rate of monthly student expenditure in the UK in the year 2016 while, the bar graph represents the percentage of sources of student income in the same year. Overall, average student expenditure for rent recorded the highest figure whereas, the sources of student income for grants and funding had the […]

You should spend about 20 minutes on thistask. The charts below show the number of Japanese tourists travelling abroad between 1985 and 1995 and Australia's share of the Japanese tourist market. Write a report for a university lecturer describing the information shown below.

The bar chart compares the number of Japanese tourists travelling abroad between 1985 and 1995, whereas the line graph tracks the fluctuations in Australia’s share of the Japanese tourist market over the same period. Overall, a cursory glance at the charts reveals an upward trajectory in both the total volume of travelers and the percentage […]

You should spend about 20 minutes on this task. The charts below show the average percentages in typical meals of three types of nutrients, all of which may be unhealthy if eaten too much. Summarise the information by selecting and reporting the main features, and make comparisons where relevant. Write at least 150 words. Average percentages of sodium, saturated fats and added sugars in typical meals consumed in the USA

The pie charts illustrate the mean percentage of nutrients namely, sodium, saturated fat and added sugar in everyday meals consumed in the United States. Overall, the nutrients are mainly consumed in breakfast, snack, lunch and dinner by different proportions. All these nutrients are consumed highest at dinner and lowest at breakfast except for added sugar. […]

See All
We have detected unusual activity on your device.
Please verify your identity to continue.
Note: This verification step won't sign you in. If you have a premium account, please log in to access the service as usual.
Google/Gmail Verification
Or verify using Email/Code
We've sent a verification code to:
youremail@gmail.com (Not your email?)
Enter it below to complete the verification process.
Ensure your email address is correct, your inbox is not full, and you check your spam folder. If no email arrives, consider using an alternative email.
You will need a Premium plan to perform your action!
Note: If you already have a premium account, please log in to access our services as usual.

Plans & Pricing

Our mission is to make quality education accessible for everyone.
However, to keep our hardworking team running and this service alive, we genuinely need your support!
By opting for a premium plan, not only do you sustain us in achieving the mission, but you also unlock advanced features to enrich your learning experience.

Free

For learners who aren't pressed for time

What's included on Free
100+ Cambridge IELTS Tests
Instant IELTS Writing Task 1 & 2 Evaluation (2 times/month)
Instant IELTS Speaking Part 1, 2, & 3 Evaluation (2 times/month)
Instant IELTS Writing Task 1 & 2 Essay Generator (2 times/month)
500+ Dictation & Shadowing Exercises
100+ Pronunciation Exercises
Flashcards
Other Advanced Tools

Premium

For those serious about advancing their English proficiency, and for IELTS candidates aspiring to boost their band score by 1-2 points (especially in writing & speaking) in just 30 days or less

What's included on Premium
Save Your IELTS Test Progress & Analyze Mistakes By Question Type
Save Your Own Flashcard Sets & Use Them On Any Device
Unlock All Courses, IELTS Tests, Section & Part Practice
Unlimited AI Conversations
Unlimited AI Writing Enhancement Exercises
Unlimited IELTS Writing Task 1 & 2 Evaluation
Unlimited IELTS Speaking Part 1, 2, & 3 Evaluation
Checked Answers Will Not Be Published
Unlimited IELTS Writing Task 1 & 2 Essay Generator
Unlimited IELTS Speaking Part 1, 2, & 3 Sample Generator
Unlimited Usage Of Advanced Tools & AI Features
Priority Support within 24h (12-month plan only)

Due to the nature of our service and the provided free trials, payments are non-refundable.