Our system will evaluate the answer based on this AI-generated description.
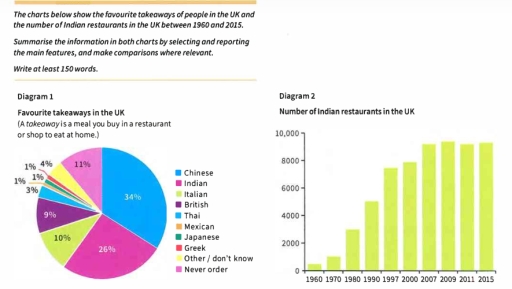
The image features two graphics: Diagram 1, a pie chart titled "Favourite takeaways in the UK" with the note "(A takeaway is a meal you buy in a restaurant or shop to eat at home.)", and Diagram 2, a vertical bar chart titled "Number of Indian restaurants in the UK". Diagram 1 shows proportions for: Chinese at 34%, Indian at 26%, Never order at 11%, Italian at 10%, British at 9%, Other / don't know at 4%, Thai at 3%, Greek at 1%, Japanese at 1%, and Mexican at 1%. Diagram 2 plots the number of restaurants on the vertical axis (labeled 0, 2000, 4000, 6000, 8000, and 10,000) against specific years on the horizontal axis: 1960 (approximately 500), 1970 (approximately 1,000), 1980 (approximately 3,000), 1990 (approximately 5,050), 1997 (approximately 7,450), 2000 (approximately 7,900), 2007 (approximately 9,200), 2009 (approximately 9,400), 2011 (approximately 9,200), and 2015 (approximately 9,300).
Given the complexity of the image, the above description may not be entirely accurate.
Skyrocket your IELTS band score by 1-2 points in under a month with our premium plan!
Note: Both the topic and the answer were created by one of our users.
The pie graph and pie chart below visualizes the statistics regarding individuals’ tastes in restaurants, from preferences of takeaways and the quantity of Indian restaurants within the UK throughout a 55 year period.
Chinese and Indian restaurants dominate the market with 3/5ths of the share where Indian restaurants started skyrocketing in locations by 1980 and onwards. Japanese, Mexican and Greek being reserved as the least common takeaway varieties.
The pie chart shows Chinese as the most common takeaway spot, taking over a 3rd of the industry. It is followed by Indian which is lower by 8%, then the option of not ordering Italian food, and British all of which are less than Indian by around 16%. Remainders are all relatively negligible to the overall takeover pie chart values, of which are Mexican, Japanese and Greek locations.
Indian restaurant locations are counted visually via the bar chart throughout 55 years. The first decade or so from 1960 and 1970 both show a low count of Indian restaurants initially created, whereby by 1980 the rates have doubled, with each year afterwards surging upwards in locations with the exception of 1997-2000 until the late 2000s where values fluctuate just below 10000.
Word Count: 198
