🔥 Today Only: Save 30% on Premium — Offer Ends Soon! - Upgrade Now!
Multiple Graphs

Band 6+: The charts below show the primary causes of deforestation and the total forest area lost in three different regions for the years 2010 and 2020. Summarise the information by selecting and reporting the main features, and make comparisons where relevant.

Image for topic: The charts below show the primary causes of deforestation and the total forest area lost in three different regions for the years 2010 and 2020. Summarise the information by selecting and reporting the main features, and make comparisons where relevant.
Our system will evaluate the answer based on this AI-generated description.
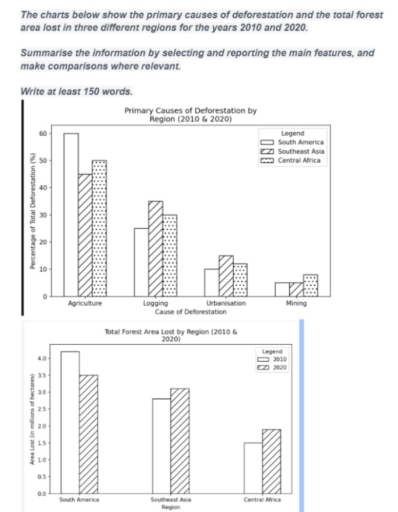
The image features two vertical bar charts. The upper chart, titled "Primary Causes of Deforestation by Region (2010 & 2020)", displays the "Percentage of Total Deforestation (%)" on the y-axis (scale 0 to 60, interval 10) against "Cause of Deforestation" on the x-axis, with a legend for three regions: South America, Southeast Asia, and Central Africa. Values by cause: Agriculture shows South America at 60%, Southeast Asia at 45%, and Central Africa at 50%; Logging shows South America at 25%, Southeast Asia at 35%, and Central Africa at 30%; Urbanisation shows South America at 10%, Southeast Asia at 15%, and Central Africa at 12%; Mining shows South America at 5%, Southeast Asia at 5%, and Central Africa at 8%. The lower chart, titled "Total Forest Area Lost by Region (2010 & 2020)", displays "Area Lost (in millions of hectares)" on the y-axis (scale 0.0 to 4.0, interval 0.5) across "Region" on the x-axis, with a legend for years 2010 and 2020. Data by region: South America lost 4.2 million hectares in 2010 and 3.5 million hectares in 2020; Southeast Asia lost 2.8 million hectares in 2010 and 3.1 million hectares in 2020; Central Africa lost 1.5 million hectares in 2010 and 1.9 million hectares in 2020.
Given the complexity of the image, the above description may not be entirely accurate.
Note: Both the topic and the answer were created by one of our users.

The two bar charts compare the main causes of deforestation and forest area lost across three regions.

Overall, agriculture was the leading cause of deforestation in all three regions, whereas mining was the least significant. South America had the greatest forest-area loss in both years, although its figure declined; losses increased in Southeast Asia and Central Africa.

Firstly, South America is the most harmed region concerning deforestation by agriculture, with approximately 60% of total deforestation, while the others are positionned in the horizons of 40% to 50%. Logging is also considerably affecting deforestation, as it amounts just over 35% in Southest Asia and 30% in Central Africa.

Nevertheless, The total volume of area lost due to deforestation is considerable. areas such as Southeast Asia and Central Africa are on an upward trend regarding the losses in hectares. For instance, despite having around 1,5 millions of hectares lost due to deforestation in 2010 in Central africa, it leaped to approximately 2 millions in 2020. In contrast to, South America listed a noticeable decrease of just over half a million hectares from 2010 to 2020.

Word Count: 183

Other Topics:

The pie charts show the sales of new cars in Australia in 1994, 2004 and 2013.

The pie charts give information on the proportion of new car sales in Australia in 1984, 1993, and 2013. Overall, the percentage of Sedans exhibited a downward trend, still they remaining the most popular car type throughout the period. In contrast, the sales of SUVs and other types of cars generally increased, with the former […]

The bar chart shows the number of heat-related illness suffered by high school students per 100 000 sports events in central US states. The line graph shows the average temperatures for one year in a central US state. Summarize the information by selecting and reporting the main features, and make comparisons where relevant. Write at least 150 words. You should spend about 20 minutes on this task. To zoom in, click on the image.

The bar chart illustrates the number of diseases caused by heat per 100,000 sports events in the USA. The line graph demonstrates average temperatures in a certain US state throughout the year. Overall, a correlation can be noticed between a number of reports of illnesses and the average temperature, as both graphs peak in summer. […]

The bar charts below provide information about honey production and honey producing colonies in the five American states in 2006

The given two bar charts illustrate the number of bee colonies and honey production in five states in America during the year 2006 respectively. The honey was measured in pounds. The highest production of honey was reported from North Dakota as approximate over 25 millions of pounds where have 350,000 honey colonies. Conversely, the lowest […]

The graph below show four categories of citrus fruits and the top three countries to which these were exported(in thousand tonnes) in 2012.

The bar charts illustrate the exportes of citruses in different countries. Overall, there are four bar charts below. First graph shows export of oranges while second one is export of lemons. Furthermore, picture shows export of grapefruits. However, last grapgh shows export of other tupes of fruits. Firstly, oranges are one of the most widespread […]

The bar chart shows the total number of tigers at all the tiger reserves in India, 1972-2002. The line graph shows the number of tigers at five individual tiger reserves in India.

There ia a bar chart showing the overall number of tigers in all Indian tiger reserves from 1972 to 2022 and there is a line graph showing the number of tigers at five different reserves over the same period. Total population in all the reserves increased steadily over the years while the Bandipur reserve remained […]

See All
We have detected unusual activity on your device.
Please verify your identity to continue.
Note: This verification step won't sign you in. If you have a premium account, please log in to access the service as usual.
Google/Gmail Verification
Or verify using Email/Code
We've sent a verification code to:
youremail@gmail.com (Not your email?)
Enter it below to complete the verification process.
Ensure your email address is correct, your inbox is not full, and you check your spam folder. If no email arrives, consider using an alternative email.
You will need a Premium plan to perform your action!
Note: If you already have a premium account, please log in to access our services as usual.

Plans & Pricing

Our mission is to make quality education accessible for everyone.
However, to keep our hardworking team running and this service alive, we genuinely need your support!
By opting for a premium plan, not only do you sustain us in achieving the mission, but you also unlock advanced features to enrich your learning experience.

Free

For learners who aren't pressed for time

What's included on Free
100+ Cambridge IELTS Tests
Instant IELTS Writing Task 1 & 2 Evaluation (2 times/month)
Instant IELTS Speaking Part 1, 2, & 3 Evaluation (2 times/month)
Instant IELTS Writing Task 1 & 2 Essay Generator (2 times/month)
500+ Dictation & Shadowing Exercises
100+ Pronunciation Exercises
Flashcards
Other Advanced Tools

Premium

For those serious about advancing their English proficiency, and for IELTS candidates aspiring to boost their band score by 1-2 points (especially in writing & speaking) in just 30 days or less

What's included on Premium
Save Your IELTS Test Progress & Analyze Mistakes By Question Type
Save Your Own Flashcard Sets & Use Them On Any Device
Unlock All Courses, IELTS Tests, Section & Part Practice
Unlimited AI Conversations
Unlimited AI Writing Enhancement Exercises
Unlimited IELTS Writing Task 1 & 2 Evaluation
Unlimited IELTS Speaking Part 1, 2, & 3 Evaluation
Checked Answers Will Not Be Published
Unlimited IELTS Writing Task 1 & 2 Essay Generator
Unlimited IELTS Speaking Part 1, 2, & 3 Sample Generator
Unlimited Usage Of Advanced Tools & AI Features
Priority Support within 24h (12-month plan only)

Due to the nature of our service and the provided free trials, payments are non-refundable.