Our system will evaluate the answer based on this AI-generated description.
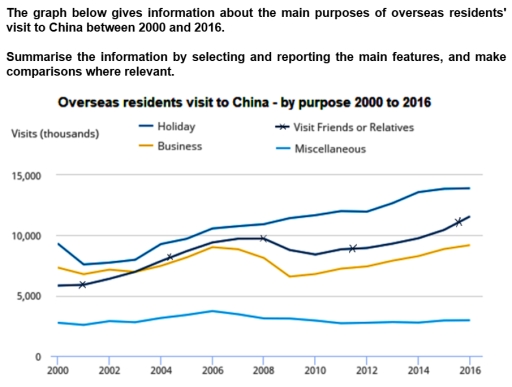
The image displays a line graph, 'Overseas residents visit to China - by purpose 2000 to 2016', with the y-axis representing visits in thousands. For Holiday, visits (in thousands) were: 2000(~9,500), 2002(~8,100), 2004(~9,100), 2006(~11,200), 2008(~11,000), 2010(~11,800), 2012(~12,800), 2014(~14,000), and 2016(~14,500). For Business, visits were: 2000(~7,500), 2002(~7,100), 2004(~8,200), 2006(~9,800), a peak in 2007(~10,000), a low in 2009(~6,200), 2012(~8,000), 2014(~8,800), and 2016(~9,500). For Visiting Friends or Relatives, visits were: 2000(~6,000), 2002(~5,800), 2004(~8,500), 2006(~9,500), 2008(~9,500), 2010(~8,200), 2012(~9,000), 2014(~10,000), and 2016(~11,500); specific data points are marked for 2001(~6,200), 2004(~8,500), 2011(~9,200), and 2015(~10,800). For Miscellaneous, visits remained flatter: 2000(~2,800), 2002(~3,000), 2004(~3,000), 2006(~3,500), 2008(~2,800), 2010(~3,200), 2012(~3,000), 2014(~3,000), and 2016(~3,200).
Given the complexity of the image, the above description may not be entirely accurate.
Skyrocket your IELTS band score by 1-2 points in under a month with our premium plan!
Note: Both the topic and the answer were created by one of our users.
The given line graph illustrates the number of overseas residents visiting China for four different purposes, namely holidays, business, visiting friends or relatives, and other activities, between 2000 and 2016. The unites are measured in thousands.
Overall, holiday visits remained the most popular purpose throughout the period, while miscellaneous visits had the lowest figures. Although all categories experienced some fluctuations, their overall trends were generally upward.
Looking at the details, holiday visits started at approximately 9,300 thousand in 2000 before falling to around 7,600 thousand in 2001. After that, the figure increased steadily, reaching about 14,000 thousand in 2016. Similarly, visits to friends or relatives rose from roughly 5,800 thousand to 9,800 thousand in 2008. Despite a decline in 2010, the number climbed to approximately 11,500 thousand by the end of the period.
Regarding business visits, the figure increased from around 7,200 thousand in 2000 to 9,000 thousand in 2006, before dropping significantly in 2009. It then recovered to about 9,200 thousand in 2016. Meanwhile, miscellaneous visits remained stable, only slight increase to around 3,500 thousand in 2006, ending at approximately 3,000 thousand.
Word Count: 183
