🔥 Today Only: Save 30% on Premium — Offer Ends Soon! - Upgrade Now!
Line Graph

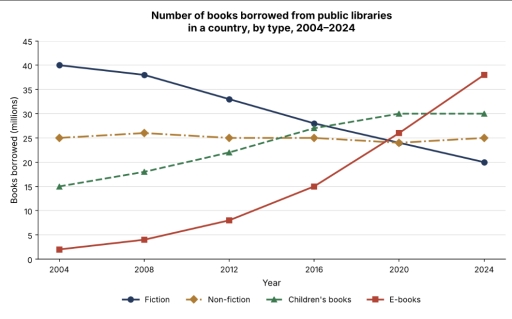
Band 5+: The graph below shows the number of books borrowed from public libraries in a country, by type, between 2004 and 2024.

Image for topic: The graph below shows the number of books borrowed from public libraries in a country, by type, between 2004 and 2024.
Our system will evaluate the answer based on this AI-generated description.
The image features a line graph titled "Number of books borrowed from public libraries in a country, by type, 2004–2024", with the vertical axis labeled "Books borrowed (millions)" ranging from 0 to 45 in intervals of 5, and the horizontal axis labeled "Year" displaying 2004, 2008, 2012, 2016, 2020, and 2024. The four tracked categories show the following values: Fiction stood at 40 million in 2004, 38 million in 2008, 33 million in 2012, 28 million in 2016, 24 million in 2020, and 20 million in 2024; Non-fiction recorded 25 million in 2004, 26 million in 2008, 25 million in 2012, 25 million in 2016, 24 million in 2020, and 25 million in 2024; Children's books were at 15 million in 2004, 18 million in 2008, 22 million in 2012, 27 million in 2016, 30 million in 2020, and 30 million in 2024; and E-books accounted for 2 million in 2004, 4 million in 2008, 8 million in 2012, 15 million in 2016, 26 million in 2020, and 38 million in 2024.
Given the complexity of the image, the above description may not be entirely accurate.
Note: Both the topic and the answer were created by one of our users.

the line graph illustrates the number of four types books people took from public libraries in a country between 2004-2024.

Overall, there is a swift away from the number of fiction books towards non-fiction books, children’s books and e-book. With e-book becoming the most borrowed kind of book. Additionally, there was a fluctuation in number of non-fiction, and the only fiction books to decline, whereas children’s book and e-book rose.

In 2004, figures for fiction books stood at 40 million, followed by non-fiction, children’s book and e-book at 25 million, 15 million, about 1 million respectively. while fiction books fell to 20 million, which means halved, non-fiction remanded 25 million by 2024.

On the other hand, the number of children’s books rose steadily, before levelling off at 30 million. Furthermore, e-books increased gradually until 2016, before rocketing at 37 million, in other words there is a thirtysevenfold in figures for the e-books.

Word Count: 152

Other Topics:

.: The lines illustrate the reletionship between rate of employed men and women, aged between 18-34 in Australia from 1976 to 2011

The line graph illustrates the proportion of employed men and women aged between 18 and 34 in Australia over a 35-year period, commencing from 1976. Overall, it is clear that men were more likely to work as they grew older, while the reverse was true for their counterparts in both years. Although the figure for […]

Percentage of household with internet connection between 2000 and 2020 in three different countries

The line graph provides a comparison of households with internet access across three various countries between 2000 and 2020. Overall, it is evident that Asia experienced a significant rise and became the greatest in 2020. Meanwhile, America accounted for lowest figures compared to other continents but showed a gradual growth throughout the period. Looking at […]

The line graph shows the consumption and production of sugar in India from 2001 to 2011. Summarise the information by selecting and reporting the main features, and make comparisons where relevant.

The given line graph provides detailed information about sugar consumption and production between 2001 and 2011 in India. Overall, while the figure for production of sugar fluctuated over the period, consumption of sugar increased noticeably during the decade. After a gradual drop from about 27 to approximately 19 between 2001 and 2005, the production of […]

The line graph shows the consumption and production of sugar in India from 2001 to 2011. Summarise the information by selecting and reporting the main features, and make comparisons where relevant.

The line graph compares and contrasts data on changes in the amount of production and consumption of sugar in India between 2001 and 2011 Overall, the volumes increased throughout the period, with production declining in 2005 before witnessing a significant growth by 2007, while consumption increased gradually. Although India produced about 27 million tonnes of […]

The line graph shows the number of visitors to three different museums between 2000 and 2020.

The line grapg illustrates changes in the number of visitors to three different musuems over the period from 2000 to 2020 Overall it is evident that museum A experienced and upword trend whereas museum B showed a opposite pattern toward the end of the period.while museum C remaind identical throughout the period turning to the […]

See All
We have detected unusual activity on your device.
Please verify your identity to continue.
Note: This verification step won't sign you in. If you have a premium account, please log in to access the service as usual.
Google/Gmail Verification
Or verify using Email/Code
We've sent a verification code to:
youremail@gmail.com (Not your email?)
Enter it below to complete the verification process.
Ensure your email address is correct, your inbox is not full, and you check your spam folder. If no email arrives, consider using an alternative email.
You will need a Premium plan to perform your action!
Note: If you already have a premium account, please log in to access our services as usual.

Plans & Pricing

Our mission is to make quality education accessible for everyone.
However, to keep our hardworking team running and this service alive, we genuinely need your support!
By opting for a premium plan, not only do you sustain us in achieving the mission, but you also unlock advanced features to enrich your learning experience.

Free

For learners who aren't pressed for time

What's included on Free
100+ Cambridge IELTS Tests
Instant IELTS Writing Task 1 & 2 Evaluation (2 times/month)
Instant IELTS Speaking Part 1, 2, & 3 Evaluation (2 times/month)
Instant IELTS Writing Task 1 & 2 Essay Generator (2 times/month)
500+ Dictation & Shadowing Exercises
100+ Pronunciation Exercises
Flashcards
Other Advanced Tools

Premium

For those serious about advancing their English proficiency, and for IELTS candidates aspiring to boost their band score by 1-2 points (especially in writing & speaking) in just 30 days or less

What's included on Premium
Save Your IELTS Test Progress & Analyze Mistakes By Question Type
Save Your Own Flashcard Sets & Use Them On Any Device
Unlock All Courses, IELTS Tests, Section & Part Practice
Unlimited AI Conversations
Unlimited AI Writing Enhancement Exercises
Unlimited IELTS Writing Task 1 & 2 Evaluation
Unlimited IELTS Speaking Part 1, 2, & 3 Evaluation
Checked Answers Will Not Be Published
Unlimited IELTS Writing Task 1 & 2 Essay Generator
Unlimited IELTS Speaking Part 1, 2, & 3 Sample Generator
Unlimited Usage Of Advanced Tools & AI Features
Priority Support within 24h (12-month plan only)

Due to the nature of our service and the provided free trials, payments are non-refundable.