Our system will evaluate the answer based on this AI-generated description.
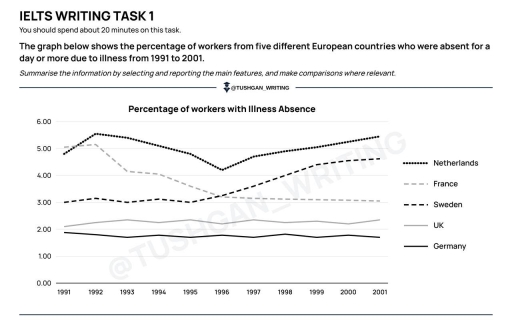
The image features a line graph titled "Percentage of workers with Illness Absence" with a vertical y-axis scaled from 0.00 to 6.00 (in intervals of 1.00) and a horizontal x-axis spanning the years 1991 to 2001. Five series are tracked: Netherlands (dotted line), France (dashed light line), Sweden (dashed dark line), UK (solid light line), and Germany (solid dark line). Approximate values from 1991 to 2001 are: for Netherlands, 4.80 in 1991, 5.55 in 1992, 5.40 in 1993, 5.10 in 1994, 4.80 in 1995, 4.20 in 1996, 4.70 in 1997, 4.90 in 1998, 5.10 in 1999, 5.30 in 2000, and 5.45 in 2001; for France, 5.05 in 1991, 5.15 in 1992, 4.15 in 1993, 4.05 in 1994, 3.60 in 1995, 3.20 in 1996, 3.15 in 1997, 3.10 in 1998, 3.10 in 1999, 3.08 in 2000, and 3.05 in 2001; for Sweden, 3.00 in 1991, 3.15 in 1992, 3.00 in 1993, 3.10 in 1994, 3.00 in 1995, 3.25 in 1996, 3.60 in 1997, 4.00 in 1998, 4.40 in 1999, 4.55 in 2000, and 4.65 in 2001; for UK, 2.10 in 1991, 2.25 in 1992, 2.35 in 1993, 2.25 in 1994, 2.30 in 1995, 2.20 in 1996, 2.35 in 1997, 2.25 in 1998, 2.30 in 1999, 2.20 in 2000, and 2.35 in 2001; and for Germany, 1.90 in 1991, 1.80 in 1992, 1.70 in 1993, 1.78 in 1994, 1.70 in 1995, 1.78 in 1996, 1.70 in 1997, 1.82 in 1998, 1.70 in 1999, 1.78 in 2000, and 1.70 in 2001.
Given the complexity of the image, the above description may not be entirely accurate.
Skyrocket your IELTS band score by 1-2 points in under a month with our premium plan!
Note: Both the topic and the answer were created by one of our users.
The line graph illustrates the proportion of workers from 5 different countries in Europe who were absent for a day or more because of disease between 1991 and 2001.
Overall,Sweden and the Netherlands showed an upward trend by the end of the period,while France decreased significantly following the period of years.Moreover,the UK and Germany,with the same starting point of percentage,remained stable almost all years.
Focusing on larger figures first,the Netherlands and Sweden,with the most pronounced growth,showed the highest levels of proportion.Sweden started out with lower points-at 3.00% in 1991,after increasing gradually between 1992 and 1995.At the beginning in 1995,the country rose sharply by the end of the period.While,France decreased significantly the following years,starting by 1992 to 2001.In 1994,the country fell from 5.00% into 4.00%.
The UK and Germany,in contrast,recorded smaller figures.The figure for the UK remained unstable starting by 1993 to 2001.In comparison,Germany started at the same point-at 2.00%,demonstrated the same trends with the UK following years.
Word Count: 157
