Our system will evaluate the answer based on this AI-generated description.
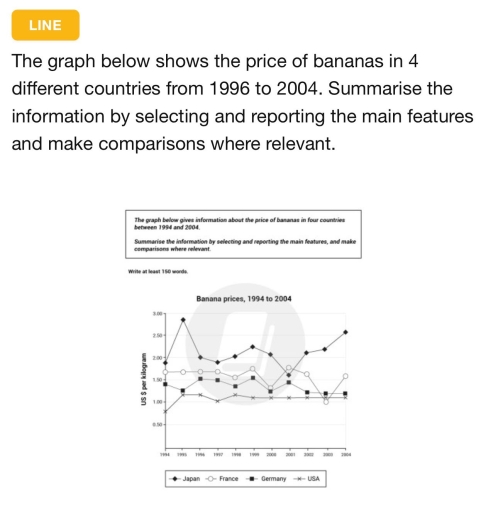
The image features a line graph titled "Banana prices, 1994 to 2004" with the vertical axis labeled "US $ per kilogram" (ranging from 0.50 to 3.00 in increments of 0.50) and the horizontal axis showing individual years from 1994 to 2004. A legend at the bottom identifies four series: Japan (diamond marker), France (circle marker), Germany (square marker), and USA (cross marker). Approximate prices per kilogram by year are: Japan: 1994 (~$1.88), 1995 (~$2.85), 1996 (~$2.00), 1997 (~$1.90), 1998 (~$2.03), 1999 (~$2.24), 2000 (~$2.08), 2001 (~$1.60), 2002 (~$2.10), 2003 (~$2.18), 2004 (~$2.58); France: 1994 (~$1.65), 1995 (~$1.67), 1996 (~$1.68), 1997 (~$1.65), 1998 (~$1.55), 1999 (~$1.73), 2000 (~$1.30), 2001 (~$1.73), 2002 (~$1.63), 2003 (~$0.98), 2004 (~$1.58); Germany: 1994 (~$1.38), 1995 (~$1.25), 1996 (~$1.52), 1997 (~$1.48), 1998 (~$1.35), 1999 (~$1.54), 2000 (~$1.23), 2001 (~$1.43), 2002 (~$1.21), 2003 (~$1.18), 2004 (~$1.18); USA: 1994 (~$0.78), 1995 (~$1.16), 1996 (~$1.15), 1997 (~$1.02), 1998 (~$1.15), 1999 (~$1.09), 2000 (~$1.10), 2001 (~$1.10), 2002 (~$1.10), 2003 (~$1.10), 2004 (~$1.10).
Given the complexity of the image, the above description may not be entirely accurate.
Skyrocket your IELTS band score by 1-2 points in under a month with our premium plan!
Note: Both the topic and the answer were created by one of our users.
The line graph illustrates the price of bananas in four different countries namely Jabab, France, Germany and the US between 1996 to 2004. The unite measured in US dollars per kilograms.
Overall, it is clear from the graph that all three countries proportions showed fluctuations. However, Jaban’s rate accounted the highest figures, while The US proportion accounted the lowest.
In terms of Japan started in 1994 with 2000 dollars, than peaked in 1995 at almost 3000 $, after dropping in 1996 with the same number ta the beginning and with unstable trend. Whereas French started at approximately 1080 dollars, and remianed steady until year 2000, which decreased slightly to 1.50 $, then followed by fluctuation.
Looking for Germany and the US proportions, in 1994 the Germany’s figures had nearly 1.50 dollars, while The US expenditure was 1.05 $. In contrast, Germany’s decreased , whereas US figures increased to (1.10). Then fluctuations followed both countries.
Word Count: 154
