Our system will evaluate the answer based on this AI-generated description.
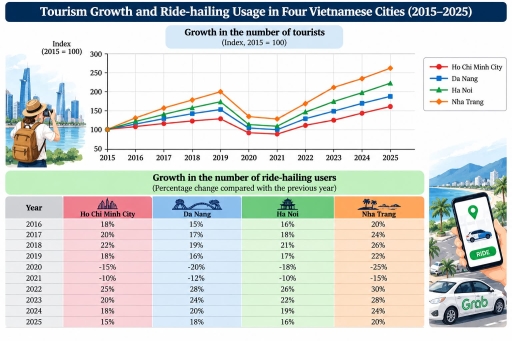
The image features a graphic titled "Tourism Growth and Ride-hailing Usage in Four Vietnamese Cities (2015–2025)" comprising a line graph and a table. The line graph is titled "Growth in the number of tourists (Index, 2015 = 100)" with a y-axis labeled "Index (2015 = 100)" scaling from 50 to 300 in increments of 50, and an x-axis showing years from 2015 to 2025. All four cities start at an index of 100 in 2015; subsequent values (2016–2025) are approximately: Ho Chi Minh City at 108, 116, 123, 129, 91, 88, 112, 125, 144, and 161; Da Nang at 116, 131, 143, 152, 105, 101, 129, 148, 170, and 187; Ha Noi at 122, 141, 157, 173, 115, 110, 148, 174, 197, and 222; and Nha Trang at 131, 156, 179, 200, 135, 128, 168, 210, 234, and 261. Below, the table is titled "Growth in the number of ride-hailing users (Percentage change compared with the previous year)" with columns for Year, Ho Chi Minh City, Da Nang, Ha Noi, and Nha Trang, listing data as follows: 2016: 18%, 15%, 16%, 20%; 2017: 20%, 17%, 18%, 24%; 2018: 22%, 19%, 21%, 26%; 2019: 18%, 16%, 17%, 22%; 2020: -15%, -20%, -18%, -25%; 2021: -10%, -12%, -10%, -15%; 2022: 25%, 28%, 26%, 30%; 2023: 20%, 24%, 22%, 28%; 2024: 18%, 20%, 19%, 24%; and 2025: 15%, 18%, 16%, 20%.
Given the complexity of the image, the above description may not be entirely accurate.
Skyrocket your IELTS band score by 1-2 points in under a month with our premium plan!
Note: Both the topic and the answer were created by one of our users.
The graph and the table illustrate the growth in tourism and ride-hailing demand in four Vietnamese cities include Ho Chi Minh city, Da Nang, Ha Noi and Nha Trang over a 10-year period.
Overall, it is clear that toursim growth and ride-hailing usage experienced an upward trend from 2015 to 2019 but then both of them underwent a steady decline and finally recovered in 2025.
Regarding the chart, the figure for toursism and ride hailing used in four cities started at precisely 100 and rose significantly in 2019 with the number of 200, 175, 150 and 125 for Nha Trang, Ha Noi, Da Nang and Ho Chi Minh city respectively. Subsequently, all of the sectors witness a slight drop in 2020 and remained stably until 2021 with the number of 130, 105, 100 and 90 for Nha Trang, Ha Noi, Da Nang and Ho Chi Minh city. Lastly, the number of toursism and ride hailing used went up rapidly until they all reached their peak with 260 for Nha Trang, 220 for Ha Noi, 190 for Da Nang and 160 for Ho Chi Minh city.
Moving on the table, the proportion of the growth in the number of ride-hailing users change compared with the previous year fluctuated dramatically. Started at 18%, 15%, 16% and 20% for Ho Chi Minh city, Da Nang, Ha Noi and Nha Trang in 2016. Then, all of the categories underwent a sharp decrease in 2020 and 2021 but later climbed up gradualy to 15%, 18%, 16% and 20% for Ho Chi Minh city, Da Nang, Ha Noi, and Nha Trang in 2025.
Word Count: 267
