🔥 Today Only: Save 30% on Premium — Offer Ends Soon! - Upgrade Now!
Line Graph

Band 7+: the line graph below shows the monthly revenue in 2008 of four shops that belong to a jewelry company.

Image for topic: the line graph below shows the monthly revenue in 2008 of four shops that belong to a jewelry company.
Our system will evaluate the answer based on this AI-generated description.
The image displays "Monthly Revenue of Jewelry & Co." with the y-axis showing "thousands of euros" from 0 to 90 in increments of 10, and the x-axis depicting months from January to December. Four shops are represented: Shop 1 (triangle symbol), Shop 2 (circle symbol), Shop 3 (square symbol), and Shop 4 (diamond symbol). Shop 1 starts at 40, steadily increases, dips below 60 in April, peaks at 80 in May, decreases to below 60 in July, exceeds 70 in August, drops to 60 in September, and surpasses 80 in December. Shop 2 commences at 20, experiences a slight drop in February, rises to over 60 in June, reduces to 50 in August, climbs to 75 in November, and marginally declines in December. Shop 3 starts at 15, steadily ascends to over 70 in October, slightly diminishes in November, and reaches approximately 80 in December. Shop 4 begins at over 10, gradually increases to above 70 in May, drops to around 70 in June, July, and August, ascends to peak at 90 in October and November, and drops to 85 in December.
Given the complexity of the image, the above description may not be entirely accurate.
Note: Both the topic and the answer were created by one of our users.

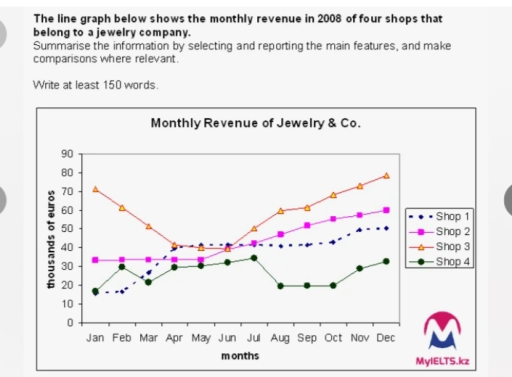
The graph illustrates profits gained monthly by four shops of Jewelry & Co.

Overall, Shop 3 showed the highest indicators of monthly revenue. Shop 2 and Shop 1 steadily increased throughout the given period, while Shop 3 and Shop 4 demonstrated a fluctuating pattern.

Out of all shops belonging to the jewelry company, Shops 1 and 2 were the only two to experience a gradual rise. Shop 1 started at approximately 16 thousand euros in January and February, then climbed enormously to around 40 thousand. After that, Shop 1 experienced a steady increase of 10 thousand euros over the rest of the period. Similarly, Shop 2 started at around 33 thousand euros in January and stayed relatively stable until May before steadily increasing to around 60 thousand in the final month.

The remaining shops witnessed fluctuation throughout the period. Shop 3 gained just over 70 thousand euros in revenue before significantly declining to around 40 thousand until June. Subsequently, Shop 3 steadily rose to a peak point of just under 80 thousand euros in December. Moreover, Shop 4 initially had around 17 thousand euros of monthly revenue, then fluctuated throughout the period before ending at approximately 30 thousand in the last month.

Word Count: 202

Answers On The Same Topic:

the line graph below shows the monthly revenue in 2008 of four shops that belong to a jewelry company.

The given line graph show the information about the monthly income of four various shops that belong to a jewelry company in 11 month. It can been clearly seen that, the most noticeable feature is Shop 4 which has the highest index, however Shop 3 gives way to the rest, having the lowest score. The […]

the line graph below shows the monthly revenue in 2008 of four shops that belong to a jewelry company.

The line graph shows the monthly revenue in 2008 of four shops that belong to a jewelry company. In general, there was an upward trend in the revenues of most shops throughout the year, with Shop 3 experiencing more irregular changes compared to the other shops. The revenue of Shop 3 decreased from 75 thousand […]

the line graph below shows the monthly revenue in 2008 of four shops that belong to a jewelry company.

The line graph illustrates monthly income of four shops of Jewellery company. Overall, it is apparent that the shops 4 and 3 have several fluctuations. Moreover, the shops 2 and 1 have increased gradually without any declines. The shop 1 has started its line with the persentage of 15K€. Likewise, the monthly revenue of the […]

the line graph below shows the monthly revenue in 2008 of four shops that belong to a jewelry company.

The graph provides information about income in each month in 2008 of four jewelry stores. Overall, there were an increasing of all companies. The most popular was shop 3, on January it was at around 70 thousand of euros. The less avenue had the 1, it stayed at around 15. I will start by looking […]

the line graph below shows the monthly revenue in 2008 of four shops that belong to a jewelry company.

The line graph beneath illustrates the income of four shops from jewelry company each month in 2008. Overall, it can be clearly seen that the shops number two and three showed the considerable increase by the end of the given period, while the stores named one and four just flattened out. To begin with the […]

See All

Other Topics:

Here is your line graph showing trends in two categories (A and B) from 2010 to 2020. You can now describe it for your IELTS Writing Task 1.

Several key trends are revealed by graph showing is two different categories A and B over an 10 years period from 2010 to 2020. From overall perspective it can be seen that the value of category A is significantly went upward. On the other hand i can be seen that category B was also considerably […]

The line graph shows the number of books that were borrowed in four different months.

The graph gives information about the figure of books that had borrowed in June, July, August and September in 2014 from four libraries: West Eaton, Ryeslip, Sutton Wood and Church Mount. Looking at the graph from an overall perspective, it’s completely clear that all figures trend are upward except in term of the Ryeslip Library. […]

The line graph shows the number of books that were borrowed in four different months.

The graph gives information about thefigure of books that had borrowed in June, July, August and September in 2014 from four libraries: West Eaton, Ryeslip, Sutton Wood and Church Mount. Looking at the graph from an overall perspective,it’s completely clear that all figures trend are upward except in term of the Ryeslip Library. Noticeably that […]

The line graph below shows the main reasons people gave for moving away from particular capital city to the countryside. Summarise the information by selecting and reporting the main features, and make comparions where relevant

The line graph compares the numbers of people who relocated from a capital city to the countryside for three different reasons between 1990 and 2010. Overall, the rising cost of living remained the leading reason for recolation, although its figure peaked in 2000 before declining slightly. By contrast, traffic and lifestyle concerns showed sustained growth, […]

The line graph below shows the number of visitors to a museum between 2005 and 2015.

The line chart provides key information about the museum visitors number from 2005 to 2015. The figures are measured in thousands. Overall, it is clear from the graph that the number of visitors to a museum increased significantly throughout the period. In addition, in 2006, the visitors number recorded the lowest, whereas in 2015, represented […]

The line graph below shows the main reasons people gave for moving away from particular capital city to the countryside. Summarise the information by selecting and reporting the main features, and make comparions where relevant

The given line graph displays the reasons for moving away from a capital city to the suburban areas over the period of 20-years from 1990 to 2010. Overall, it can be seen that all figures followed an upward trajectory throughout the period. In addition, the risingcost of living recorded a higher figure rather than the […]

See All
We have detected unusual activity on your device.
Please verify your identity to continue.
Note: This verification step won't sign you in. If you have a premium account, please log in to access the service as usual.
Google/Gmail Verification
Or verify using Email/Code
We've sent a verification code to:
youremail@gmail.com (Not your email?)
Enter it below to complete the verification process.
Ensure your email address is correct, your inbox is not full, and you check your spam folder. If no email arrives, consider using an alternative email.
You will need a Premium plan to perform your action!
Note: If you already have a premium account, please log in to access our services as usual.

Plans & Pricing

Our mission is to make quality education accessible for everyone.
However, to keep our hardworking team running and this service alive, we genuinely need your support!
By opting for a premium plan, not only do you sustain us in achieving the mission, but you also unlock advanced features to enrich your learning experience.

Free

For learners who aren't pressed for time

What's included on Free
100+ Cambridge IELTS Tests
Instant IELTS Writing Task 1 & 2 Evaluation (2 times/month)
Instant IELTS Speaking Part 1, 2, & 3 Evaluation (2 times/month)
Instant IELTS Writing Task 1 & 2 Essay Generator (2 times/month)
500+ Dictation & Shadowing Exercises
100+ Pronunciation Exercises
Flashcards
Other Advanced Tools

Premium

For those serious about advancing their English proficiency, and for IELTS candidates aspiring to boost their band score by 1-2 points (especially in writing & speaking) in just 30 days or less

What's included on Premium
Save Your IELTS Test Progress & Analyze Mistakes By Question Type
Save Your Own Flashcard Sets & Use Them On Any Device
Unlock All Courses, IELTS Tests, Section & Part Practice
Unlimited AI Conversations
Unlimited AI Writing Enhancement Exercises
Unlimited IELTS Writing Task 1 & 2 Evaluation
Unlimited IELTS Speaking Part 1, 2, & 3 Evaluation
Checked Answers Will Not Be Published
Unlimited IELTS Writing Task 1 & 2 Essay Generator
Unlimited IELTS Speaking Part 1, 2, & 3 Sample Generator
Unlimited Usage Of Advanced Tools & AI Features
Priority Support within 24h (12-month plan only)

Due to the nature of our service and the provided free trials, payments are non-refundable.