Our system will evaluate the answer based on this AI-generated description.
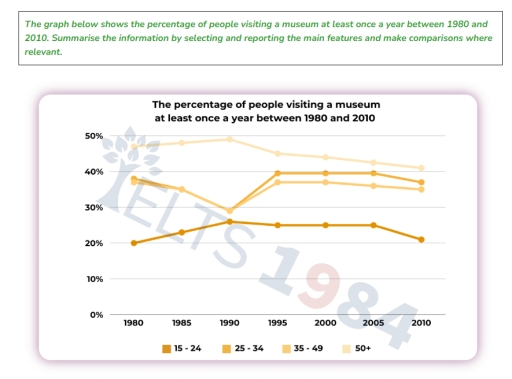
The image features a line graph titled "The percentage of people visiting a museum at least once a year between 1980 and 2010". The vertical axis displays percentages ranging from 0% to 50% in 10% intervals (0%, 10%, 20%, 30%, 40%, 50%), while the horizontal axis displays years at five-year intervals from 1980 to 2010 (1980, 1985, 1990, 1995, 2000, 2005, 2010). The legend at the bottom defines four age categories: 15 - 24, 25 - 34, 35 - 49, and 50+. For the 15 - 24 age group, data points are approximately 20% (1980), 23% (1985), 26% (1990), 25% (1995), 25% (2000), 25% (2005), and 21% (2010). For 25 - 34, values are approximately 38% (1980), 35% (1985), 29% (1990), 39.5% (1995), 39.5% (2000), 39.5% (2005), and 37% (2010). For 35 - 49, points register at roughly 37% (1980), 35% (1985), 29% (1990), 37% (1995), 37% (2000), 36% (2005), and 35% (2010). For 50+, the figures are approximately 47% (1980), 48% (1985), 49% (1990), 45% (1995), 44% (2000), 42.5% (2005), and 41% (2010).
Given the complexity of the image, the above description may not be entirely accurate.
Skyrocket your IELTS band score by 1-2 points in under a month with our premium plan!
Note: Both the topic and the answer were created by one of our users.
Overall, it is clear that the over 50s were the most frequent visitors to the museum throughout the entire time-frame , whereas the youngest group aged 15 to 24 maintained the lowest participation rates. . While the three older group witnessed a slight decrease , the visitors aged 15 to 24 experienced a marginally increase.
Looking at the youngest and the oldest groups, in 1980, around 48% of the latter visited museum annually, more than double the former’s 20%. Subsequently, visitors of the older group underwent a slight increase to just under 50% by 1990 before gradually declining to around 40% in the final year.In contrast, there was a moderate growth seen in the younger group , with its number reaching the peak of around 25% , and remaining around that level until 2005and eventually dropped back down to around 21% by the end of the period.
Regarding the remaining groups after commencing the period at around 38% ,both 15-24 and 25-34-year-olds saw a significant decline to just under 30% in 1990. However, both figures rebounded sharply by 1995, surging to 40% and 37% respectively. Over the subsequent fifteen years, the museum attendance of these two middle-aged brackets remained relatively unchanged before dipping slightly in 2010 to finish at 37% and 35% respectively
Word Count: 213
