🔥 Today Only: Save 30% on Premium — Offer Ends Soon! - Upgrade Now!
Multiple Graphs

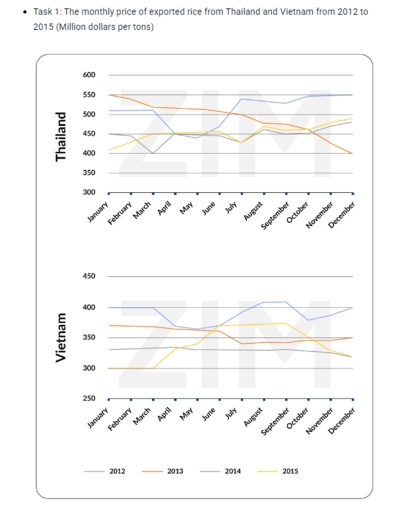
Band 7+: The monthly price of exported rice from Thailand and Vietnam from 2012 to 2015 (Million dollars per tons). Summarise the information by selecting and reporting the main features, and make comparisons where relevant.

Image for topic: The monthly price of exported rice from Thailand and Vietnam from 2012 to 2015 (Million dollars per tons). Summarise the information by selecting and reporting the main features, and make comparisons where relevant.
Our system will evaluate the answer based on this AI-generated description.
The image features two line graphs labeled "Thailand" (top) and "Vietnam" (bottom), sharing an x-axis showing months from January to December and a common legend for years 2012, 2013, 2014, and 2015. For Thailand, the y-axis ranges from 300 to 600 in increments of 50. Data points for 2012 are approximately: Jan 510, Feb 510, Mar 510, Apr 450, May 440, Jun 470, Jul 540, Aug 535, Sep 530, Oct 550, Nov 550, Dec 550; for 2013: Jan 550, Feb 540, Mar 520, Apr 515, May 515, Jun 510, Jul 500, Aug 480, Sep 475, Oct 460, Nov 430, Dec 400; for 2014: Jan 450, Feb 445, Mar 400, Apr 450, May 450, Jun 445, Jul 430, Aug 460, Sep 450, Oct 450, Nov 470, Dec 480; and for 2015: Jan 410, Feb 430, Mar 450, Apr 450, May 455, Jun 460, Jul 430, Aug 470, Sep 460, Oct 460, Nov 480, Dec 490. For Vietnam, the y-axis ranges from 250 to 450 in increments of 50. Data points for 2012 are approximately: Jan 400, Feb 400, Mar 400, Apr 370, May 365, Jun 370, Jul 390, Aug 410, Sep 410, Oct 380, Nov 385, Dec 400; for 2013: Jan 370, Feb 370, Mar 368, Apr 365, May 363, Jun 360, Jul 340, Aug 342, Sep 342, Oct 345, Nov 345, Dec 350; for 2014: Jan 330, Feb 332, Mar 335, Apr 335, May 330, Jun 330, Jul 330, Aug 330, Sep 330, Oct 328, Nov 325, Dec 320; and for 2015: Jan 300, Feb 300, Mar 300, Apr 330, May 340, Jun 370, Jul 370, Aug 372, Sep 375, Oct 350, Nov 330, Dec 320.
Given the complexity of the image, the above description may not be entirely accurate.
Note: Both the topic and the answer were created by one of our users.

The line charts illustrate the changes in the monthly price of exported rice from Thailand and Vietnam over the period from 2012 to 2015, measured in dollars per ton.

Overall, fluctuating trends can be observed throughout the period, except for minor seasonal variations. While Thailand consistently remained the dominant category, Vietnam experienced the most dramatic changes and lower price levels throughout the timeframe. By contrast, the lowest price groups remained relatively stable.

In 2012, Thailand emerged as the leading category, standing at 500 dollars, while other years followed at lower points respectively. By comparison, the figures for the initial months were far less significant, at approximately 400 dollars. However, the subsequent years witnessed significant fluctuations. While the price in 2013 declined gradually, other years followed a fluctuating trajectory, eventually reaching 480 dollars by December.

In contrast to the trends observed in Thailand, Vietnam followed a different pattern throughout the timeframe. Although starting from a relatively low base, the price experienced substantial growth, eventually recovering by 2015. By the end of the timeframe, Thailand had consolidated its position as the dominant category at approximately 500 dollars, whereas Vietnam remained the lowest, standing at only around 350 dollars.

Word Count: 196

Answers On The Same Topic:

The monthly price of exported rice from Thailand and Vietnam from 2012 to 2015 (Million dollars per tons). Summarise the information by selecting and reporting the main features, and make comparisons where relevant.

The line chart delineates the structural changes in the monthly price of exported rice from Thailand and Viet Nam over a 3-year period spanning from 2012 to 2015, measured on million dollar per tons. Overall, it is immediately apparent that while the figures on 2012 in ThaiLand and Viet Nam exhibited a sustained upward trajectory […]

The monthly price of exported rice from Thailand and Vietnam from 2012 to 2015 (Million dollars per tons). Summarise the information by selecting and reporting the main features, and make comparisons where relevant.

The line chart given compares given the monthly price of exported rice in Thailand and Vietnam based on how much from 2012 to 2015. Looking at the illustration, it is immediately evident that Thailand recorded the highest figure throughout the period, whereas the opposite was true for Vietnam. Additionally, most subjects surveyed showed some fluctuations […]

See All

Other Topics:

The table shows total revenue created by complementary medicine over three years. The two charts illustrate the number of hospitals offering complementary medicine over twenty five years with a further classification showing which kinds of medicine proved the most popular in 2012. Summarise the data by selecting and reporting the main features and make comparisons where relevant.

The provided table illustrates the total revenue generated by complementary medicine over three years. In contrast, the provided line graph and bar chart depict the number of hospitals offering complementary medicine from 1985 to 2010, with a further classification showing which nine types of medicine proved the most popular in 2012. Overall, the table shows […]

The charts below show average age of men and women retired from work in seven countries in 2004 and 2008. Summarise the information by selecting and reporting the main features, and make comparisons where relevant

The bar charts compare the average ages of men and women in seven European countries in 2004 and 2008. Overall, Sweden recorded the highest average ages for both genders, whereas France had the lowest figures. Average ages generally increased over the period, although slight declines were observed among women in France and Italy, while the […]

The line graph shows the amount of electricity produced from three different sources in a European country between 1990 and 2020. The bar chart shows the percentage of electricity consumed by four sectors in the same country in 2020. Summarise the information by selecting and reporting the main features, and make comparisons where relevant.

The line graph illustrates the amount of electricity produced from oil, neclear, and renewables source in a European country from 1990 to 2020, while the bar chart present the proportion of electricity consumption by four sectors in the same nation in 2020. Overall, electricity production by oil experienced a massive fall, while renewable energy witnessed […]

You should spend about 20 minutes on this task. The pie charts below show the data regarding the time people spend on smartphones and tablets, divided by category.

The pie charts illustrate the time spent on smartphones and tablets, by various categories. Overall, games dominating the other categories in both of the devices, whereas people viewed lower news in smartphones as well as in tablets. According to the pie charts, 29% time devoted to social networking in smartphones, which decreases in case of […]

Exercise 2: The monthly price of exported rice from Thailand and Vietnam from 2012 to 2015 (Million dollars per tons).

The line chart 1 shows the monthly price exported in Thailand from 2012 to 2015, while the line chart 2 illustrates this data too during the same timeframe. Overall, it is clear that while the figures for 2012, 2014, 2015 witnessed an upward trend, the opposite was true for 2013, with 2012 overtaking 2013 to […]

See All
We have detected unusual activity on your device.
Please verify your identity to continue.
Note: This verification step won't sign you in. If you have a premium account, please log in to access the service as usual.
Google/Gmail Verification
Or verify using Email/Code
We've sent a verification code to:
youremail@gmail.com (Not your email?)
Enter it below to complete the verification process.
Ensure your email address is correct, your inbox is not full, and you check your spam folder. If no email arrives, consider using an alternative email.
You will need a Premium plan to perform your action!
Note: If you already have a premium account, please log in to access our services as usual.

Plans & Pricing

Our mission is to make quality education accessible for everyone.
However, to keep our hardworking team running and this service alive, we genuinely need your support!
By opting for a premium plan, not only do you sustain us in achieving the mission, but you also unlock advanced features to enrich your learning experience.

Free

For learners who aren't pressed for time

What's included on Free
100+ Cambridge IELTS Tests
Instant IELTS Writing Task 1 & 2 Evaluation (2 times/month)
Instant IELTS Speaking Part 1, 2, & 3 Evaluation (2 times/month)
Instant IELTS Writing Task 1 & 2 Essay Generator (2 times/month)
500+ Dictation & Shadowing Exercises
100+ Pronunciation Exercises
Flashcards
Other Advanced Tools

Premium

For those serious about advancing their English proficiency, and for IELTS candidates aspiring to boost their band score by 1-2 points (especially in writing & speaking) in just 30 days or less

What's included on Premium
Save Your IELTS Test Progress & Analyze Mistakes By Question Type
Save Your Own Flashcard Sets & Use Them On Any Device
Unlock All Courses, IELTS Tests, Section & Part Practice
Unlimited AI Conversations
Unlimited AI Writing Enhancement Exercises
Unlimited IELTS Writing Task 1 & 2 Evaluation
Unlimited IELTS Speaking Part 1, 2, & 3 Evaluation
Checked Answers Will Not Be Published
Unlimited IELTS Writing Task 1 & 2 Essay Generator
Unlimited IELTS Speaking Part 1, 2, & 3 Sample Generator
Unlimited Usage Of Advanced Tools & AI Features
Priority Support within 24h (12-month plan only)

Due to the nature of our service and the provided free trials, payments are non-refundable.