🔥 Today Only: Save 30% on Premium — Offer Ends Soon! - Upgrade Now!
Multiple Graphs

Band 7+: You should spend about 20 minutes on this task. The line graphs below show the subscriptions to mobile and fixed phone lines in four different countries between 2005 and 2015. Summarise the information by selecting and reporting the main features and make comparisons where relevant. Write at least 150 words.

Image for topic: You should spend about 20 minutes on this task. The line graphs below show the subscriptions to mobile and fixed phone lines in four different countries between 2005 and 2015. Summarise the information by selecting and reporting the main features and make comparisons where relevant. Write at least 150 words.
Our system will evaluate the answer based on this AI-generated description.
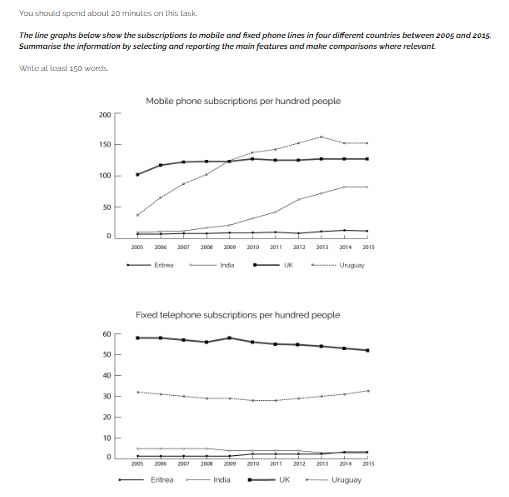
The image presents two line graphs for mobile and fixed telephone subscriptions per hundred people in Eritrea, India, the UK, and Uruguay from 2005 to 2015. In mobile subscriptions, the UK starts at about 75 in 2005, peaking at around 120 in 2010 and then slightly dropping to 115 by 2015; India starts at near 0 in 2005, dramatically rising to around 70 by 2015; Eritrea remains flat at slightly above 0 throughout; Uruguay starts at 50, peaking at above 150 in 2010, and slightly decreasing to 140 by 2015. In fixed telephone subscriptions, the UK starts at 60 in 2005, descending steadily to approximately 55 by 2015; India starts below 10 in 2005, gradually peaking at around 10 in 2010 before declining to near 5 by 2015; Eritrea remains constant around 2 throughout; Uruguay remains steady at 15 from 2005, decreasing slightly to 10 by 2015.
Given the complexity of the image, the above description may not be entirely accurate.
Note: Both the topic and the answer were created by one of our users.

The line graphs illustrate the number of mobile and fixed telephone subscriptions per hundred people in Eritrea, India, the UK, and Uruguay between 2005 and 2015.

Overall, mobile phone subscriptions increased significantly across all four countries, while fixed-line subscriptions declined or remained low. Uruguay and the UK had the highest mobile usage, whereas India showed the most rapid growth.

By 2013, Uruguay had the highest mobile penetration, peaking at nearly 170 subscriptions per hundred people before slightly declining. The UK followed a similar trend, rising from 100 in 2005 to approximately 130 in 2007, where it then plateaued. India’s mobile usage grew exponentially, from about 10 in 2005 to over 80 in 2015. In contrast, Eritrea had minimal growth, remaining below 20 per hundred people.

For fixed-line subscriptions, the UK had the highest figures, declining gradually from 55 to below 50 per hundred people. Uruguay initially had around 30 subscriptions per hundred people, which dipped slightly before increasing after 2012. India and Eritrea had the lowest fixed-line usage, staying below 10 per hundred people throughout the period.

Word Count: 177

Answers On The Same Topic:

You should spend about 20 minutes on this task. The line graphs below show the subscriptions to mobile and fixed phone lines in four different countries between 2005 and 2015. Summarise the information by selecting and reporting the main features and make comparisons where relevant. Write at least 150 words.

The line graphs illustrates information regarding subscriptions to cell phones and landline telephones from the year 2005 to 2015 in four different countries (India, UK, Eritrea and Uruguay). Overall, mobile phone subscriptions had a higher connections per hundred people in comparison to fixed telephone connections, signifying the general preference for mobile phones. However, in the […]

You should spend about 20 minutes on this task. The line graphs below show the subscriptions to mobile and fixed phone lines in four different countries between 2005 and 2015. Summarise the information by selecting and reporting the main features and make comparisons where relevant. Write at least 150 words.

The provided line graphs illustrate the trends in mobile and fixed telephone subscriptions per hundred people across four distinct countries, namely Eritrea, India, the UK, and Uruguay, over a period spanning from 2005 to 2015. A discernible disparity in subscription patterns emerges, with mobile phone subscriptions witnessing pronounced growth in several countries, while fixed telephone […]

You should spend about 20 minutes on this task. The line graphs below show the subscriptions to mobile and fixed phone lines in four different countries between 2005 and 2015. Summarise the information by selecting and reporting the main features and make comparisons where relevant. Write at least 150 words.

The line graphs illustrates the subscriptions to devices such as mobile phone and fixed phone lines per 100 people in four different countries ( India, the UK, Uruguay, Eritrea) from 2005 to 2015. It highlights main upward trends and key differences among the given data. Overall, it is clear that, Uruguay was major leading country […]

You should spend about 20 minutes on this task. The line graphs below show the subscriptions to mobile and fixed phone lines in four different countries between 2005 and 2015. Summarise the information by selecting and reporting the main features and make comparisons where relevant. Write at least 150 words.

The line graphs provides information about number of subscriptions per hundred of people for fixed and moblie pone lines in four different countries: Eritrea, India, the UK, and Uruguay between 2005 and 2015. Overall, there were fluctuations in all for countries for fixed telephone subscriptions. Additionally, while the UK and Eritrea remained relatively stable, India […]

See All

Other Topics:

The bar chart and pie chart show the amount of carbon dioxide (CO₂) emitted by three different income groups in 1990 and 2000, and the proportion of the world's population represented by each income group in 2000.

The bar chart illustrates the amount of carbon dioxide omitted into the air by various income groups from 1990 to 2000, whereas the pie chart demonstrates the proportion of the citizens represented by the high, low and middle-income groups in the world in 2000. In general, carbon dioxide emissions rose for the middle and low-income […]

The charts give information about timber and world forest abundance in five different regions. Summarise the information by selecting and reporting the main features, and make comparisons where relevant.

The provided pie charts showcase the percentage of forest and timber in five continents, South America, Africa, Asia, Europe, and North America. Overall, Africa has the largest percentage of world forest, whereas the least proportion of trees is occupied in Asia. The highest percentage of timber exists in South America. In contrast, the opposite is […]

The bar chart and pie chart show the amount of carbon dioxide (CO₂) emitted by three different income groups in 1990 and 2000, and the proportion of the world's population represented by each income group in 2000.

The pie and bar charts detail the emitted carbon dioxide by variety of income groups. Overall, in terms of the level of the released gas, except for high income group, most groups experienced an increase within a decade. While middle income had the highest numbers overall, the reverse was true for low income group. According […]

The pie chart and the line graph shows the workforce and the unemployment in Australia from 1996 to 2003. Summarize the information by selecting and reporting the main features and make comparison where relevant. (Mixed Charts)

The pie chart and graph chart illustrate the jobforce and unemployment by region of birth from 1996 to 2003 in Australia. Overall, Australian employees recorded the highest share of workforce, while people who born in non English nations had the lowest proportion. Furthermore, unemployment in Australia showed a significant decrease across the period. In detail, […]

The two pie charts below show how an average households in Australia used energy for different purposes in 1995 to 2015

The two pie chart illustrate information about household energy use in Australia in 1995 and 2015, and divided by 5 categories: lighting, refrigeration, water heating, heating and other appliances. Overall, it is clear that heating and water were the two dominant uses of household in both years. Lighting shows the same percentage of use, while […]

Write a report for a university lecturer describing the information in the graphs below. You should write at least 150 words.

The graphs illustrate the number of deaths in England in 1990 due to six different diseases and the amount of funding allocated for research into each of those diseases. Overall, the quantity of money provided for the study did not correspond with the severity of the disseverity of the diseases as measured by the number […]

See All
We have detected unusual activity on your device.
Please verify your identity to continue.
Note: This verification step won't sign you in. If you have a premium account, please log in to access the service as usual.
Google/Gmail Verification
Or verify using Email/Code
We've sent a verification code to:
youremail@gmail.com (Not your email?)
Enter it below to complete the verification process.
Ensure your email address is correct, your inbox is not full, and you check your spam folder. If no email arrives, consider using an alternative email.
You will need a Premium plan to perform your action!
Note: If you already have a premium account, please log in to access our services as usual.

Plans & Pricing

Our mission is to make quality education accessible for everyone.
However, to keep our hardworking team running and this service alive, we genuinely need your support!
By opting for a premium plan, not only do you sustain us in achieving the mission, but you also unlock advanced features to enrich your learning experience.

Free

For learners who aren't pressed for time

What's included on Free
100+ Cambridge IELTS Tests
Instant IELTS Writing Task 1 & 2 Evaluation (2 times/month)
Instant IELTS Speaking Part 1, 2, & 3 Evaluation (2 times/month)
Instant IELTS Writing Task 1 & 2 Essay Generator (2 times/month)
500+ Dictation & Shadowing Exercises
100+ Pronunciation Exercises
Flashcards
Other Advanced Tools

Premium

For those serious about advancing their English proficiency, and for IELTS candidates aspiring to boost their band score by 1-2 points (especially in writing & speaking) in just 30 days or less

What's included on Premium
Save Your IELTS Test Progress & Analyze Mistakes By Question Type
Save Your Own Flashcard Sets & Use Them On Any Device
Unlock All Courses, IELTS Tests, Section & Part Practice
Unlimited AI Conversations
Unlimited AI Writing Enhancement Exercises
Unlimited IELTS Writing Task 1 & 2 Evaluation
Unlimited IELTS Speaking Part 1, 2, & 3 Evaluation
Checked Answers Will Not Be Published
Unlimited IELTS Writing Task 1 & 2 Essay Generator
Unlimited IELTS Speaking Part 1, 2, & 3 Sample Generator
Unlimited Usage Of Advanced Tools & AI Features
Priority Support within 24h (12-month plan only)

Due to the nature of our service and the provided free trials, payments are non-refundable.