Our system will evaluate the answer based on this AI-generated description.
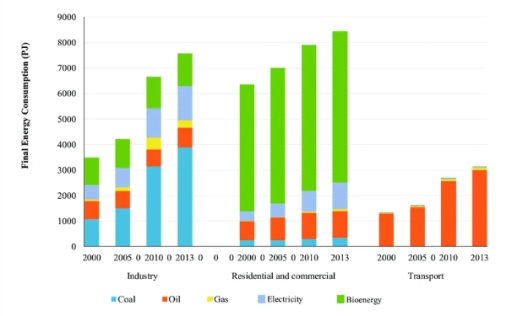
The image features a stacked bar chart displaying "Final Energy Consumption (PJ)" on the vertical axis, scaled from 0 to 9000 at intervals of 1000, across three sectors labeled on the horizontal axis: "Industry", "Residential and commercial", and "Transport", each evaluated across the years 2000, 2005, 2010, and 2013. The legend denotes five energy types: Coal, Oil, Gas, Electricity, and Bioenergy. In Industry, total consumption is approximately 3500 PJ in 2000 (Coal ~1100, Oil ~700, Gas ~100, Electricity ~500, Bioenergy ~1100), ~4200 PJ in 2005 (Coal ~1500, Oil ~700, Gas ~100, Electricity ~800, Bioenergy ~1100), ~6650 PJ in 2010 (Coal ~3150, Oil ~650, Gas ~450, Electricity ~1150, Bioenergy ~1250), and ~7600 PJ in 2013 (Coal ~3900, Oil ~750, Gas ~300, Electricity ~1350, Bioenergy ~1300). In Residential and commercial, total consumption is ~6350 PJ in 2000 (Coal ~250, Oil ~750, Electricity ~400, Bioenergy ~4950), ~7000 PJ in 2005 (Coal ~250, Oil ~900, Electricity ~550, Bioenergy ~5300), ~7900 PJ in 2010 (Coal ~300, Oil ~1000, Gas ~100, Electricity ~800, Bioenergy ~5700), and ~8450 PJ in 2013 (Coal ~350, Oil ~1050, Gas ~100, Electricity ~1000, Bioenergy ~5950). In Transport, consumption consists predominantly of Oil with minor slices of other fuels, totaling ~1350 PJ in 2000 (Oil ~1300, Bioenergy ~50), ~1650 PJ in 2005 (Oil ~1550, Bioenergy ~100), ~2700 PJ in 2010 (Oil ~2600, Electricity/Gas/Bioenergy ~100), and ~3150 PJ in 2013 (Oil ~3000, Gas/Electricity/Bioenergy ~150).
Given the complexity of the image, the above description may not be entirely accurate.
Skyrocket your IELTS band score by 1-2 points in under a month with our premium plan!
Note: Both the topic and the answer were created by one of our users.
The provided diagram displays the energy consumed by three different sectors, i.e., Commercial, Transport, and Industrial. The unit used for the calculation of consumption numbers is PJ.
Overall, two main differences were noticed for consumption. The first one was that the commercial and residential sectors consumed the highest amount of energy as compared to the others, and the second one was that the industrial sector used the highest amount of coal for its consumption.
In the starting period, the residential and commercial sectors’ bioenergy consumption was about 5000 PJ in 2000, which was about four times higher than the energy consumption of the industrial sector, and it steadily increased throughout the entire period, reaching its peak value at about 7000 PJ in 2013. The consumption of oil in transport moved upward every year because all the vehicles used for transport purposes are mostly dependent upon petrol and diesel. The consumption of coal in residential and commercial sectors almost remained constant for the whole period.
Word Count: 164
