🔥 Today Only: Save 30% on Premium — Offer Ends Soon! - Upgrade Now!
Bar Chart

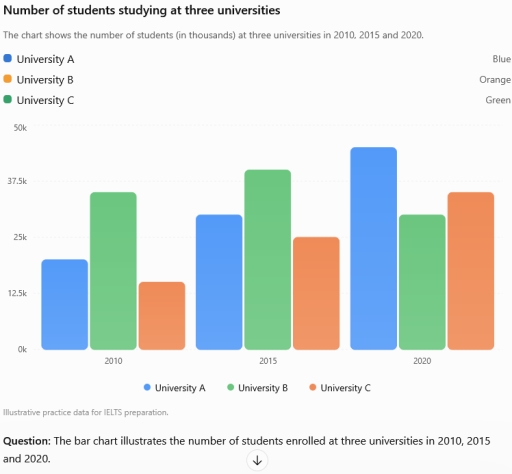
Band 6+: The bar chart shows the number of students enrolled at 3 universities in 2010, 2015 and 2020. Summarise the information by selecting and reporting the main features, and make comparisons where relevant.

Image for topic: The bar chart shows the number of students enrolled at 3 universities in 2010, 2015 and 2020. Summarise the information by selecting and reporting the main features, and make comparisons where relevant.
Our system will evaluate the answer based on this AI-generated description.
The image features a grouped bar chart titled "Number of students studying at three universities" with the subtitle "The chart shows the number of students (in thousands) at three universities in 2010, 2015 and 2020." The vertical axis represents the number of students with gridlines marked at 0k, 12.5k, 25k, 37.5k, and 50k, while the horizontal axis displays three years: 2010, 2015, and 2020. Two legends are present: the top legend lists University A (Blue), University B (Orange), and University C (Green), while the bottom legend lists University A (blue), University B (green), and University C (orange). For 2010, the blue bar is at 20k, the green bar is at 35k, and the orange bar is at 15k. For 2015, the blue bar stands at 30k, the green bar at 40k, and the orange bar at 25k. For 2020, the blue bar reaches 45k, the green bar is at 30k, and the orange bar stands at 35k.
Given the complexity of the image, the above description may not be entirely accurate.
Note: Both the topic and the answer were created by one of our users.

The bar chart compares the number of students admitted at three universities in 2010,2015 and 2020.

Overall, it can be seen that university A and C increased in students enrolment during the entire period. While university B experienced upward trend initially, after which it fell during last year.

In 2010, university B showed the highest enrolment of students which is almost 36K, compared to university A which is 20K and university C shows the lowest number of students which is about 13k. By 2015, the figures had risen to 40k in university B and 30K in university A. similarly the population of students in university C increased to 20k.

In 2020, university A and C showed a considerable increase in students enrolment which is approximately 45K and 30k respectively. While university B enrolment declined of by 10k students and the number of students enrolment reached to 30k.

Word Count: 147

Other Topics:

The bar graph shows the profit made by SMG Entertainment in three European countries in the years 1997 and 2007.

The bar charts compare the revenue generated in million euros by SMG Entertainment across five music categories in Germany, France and Italy during the years 1997 and 2007. Overall, shops-bought CDs accounted for highest profits, although their earnings declined considerably. Meanwhile, CDs bought online and internet downloads gained importance, whereas cassettes as well as vinyl […]

The bar graph shows the profit made by SMG Entertainment in three European countries in the years 1997 and 2007.

The bar charts compare the revenue generated in million euros by SMG Entertainment across five music categories in Germany, France and Italy during the years 1997 and 2007. Overall, shops-bought CDs accounted for highest profits, although their earnings declined considerably. Meanwhile, CDs bought online and internet downloads gained importance, whereas cassettes as well as vinyl […]

You should allocate approximately 20 minutes to this task. The hypothetical bar chart shows the educational attainment levels in the United States for the years 2015, 2019, and 2023. Analyze the chart to summarize key trends and make comparison where relevant. Please write a minimum of 150 words.

The chart presents the proportion of educational degrees in the United states in three specific years 2015, 2019 and 2023. The units are measured in percentage. Overall, it is clear from the chart that the vast majority of people have high school attainment in all the three years. In addition, the highest post-school degrees were […]

The chart gives information on the percentage of women going into higher education in five countries for the years 1980 and 2015. Summarise the information by selecting and reporting the main features, and make comparisons where relevant. Write at least 150 words.

The provided bar chart depicts the proportion of female students graduated to get to a high level of education in 5 different countries in the years of 1970 and 2005. Generally, it is obvious that Canada and Uk hold the most notable figure for female graduators in 2005 which was 60%. Contrarily, the figure for […]

The bar chart below describes the gross domestic spending on research and development in five countries between 2001 and 2011. Summarise the information by selecting and reporting the main features, and make comparisons where relevant.

The bar chart illustrates the gross domestic expenditure on research and development in five different nations from 2001 to 2011. Overall, it is noticeable that the percentage of expenditure showed a upward trend in China and Spain throughout the period, except in France, UK. USA, which had some fluctuations. Notably, both China and Spain accounted […]

The bar chart shows the amount of money spent on two types of electronic items in country x.

The bar chart compares the amount of money spent on two types of electronic items, computers and smartphones, in country X over a period of five years, from 2011 to 2015. Overall, spending on both computers and smartphones increased over the period. Computers had the highest spending in every year Looking at computers, spending was […]

See All
We have detected unusual activity on your device.
Please verify your identity to continue.
Note: This verification step won't sign you in. If you have a premium account, please log in to access the service as usual.
Google/Gmail Verification
Or verify using Email/Code
We've sent a verification code to:
youremail@gmail.com (Not your email?)
Enter it below to complete the verification process.
Ensure your email address is correct, your inbox is not full, and you check your spam folder. If no email arrives, consider using an alternative email.
You will need a Premium plan to perform your action!
Note: If you already have a premium account, please log in to access our services as usual.

Plans & Pricing

Our mission is to make quality education accessible for everyone.
However, to keep our hardworking team running and this service alive, we genuinely need your support!
By opting for a premium plan, not only do you sustain us in achieving the mission, but you also unlock advanced features to enrich your learning experience.

Free

For learners who aren't pressed for time

What's included on Free
100+ Cambridge IELTS Tests
Instant IELTS Writing Task 1 & 2 Evaluation (2 times/month)
Instant IELTS Speaking Part 1, 2, & 3 Evaluation (2 times/month)
Instant IELTS Writing Task 1 & 2 Essay Generator (2 times/month)
500+ Dictation & Shadowing Exercises
100+ Pronunciation Exercises
Flashcards
Other Advanced Tools

Premium

For those serious about advancing their English proficiency, and for IELTS candidates aspiring to boost their band score by 1-2 points (especially in writing & speaking) in just 30 days or less

What's included on Premium
Save Your IELTS Test Progress & Analyze Mistakes By Question Type
Save Your Own Flashcard Sets & Use Them On Any Device
Unlock All Courses, IELTS Tests, Section & Part Practice
Unlimited AI Conversations
Unlimited AI Writing Enhancement Exercises
Unlimited IELTS Writing Task 1 & 2 Evaluation
Unlimited IELTS Speaking Part 1, 2, & 3 Evaluation
Checked Answers Will Not Be Published
Unlimited IELTS Writing Task 1 & 2 Essay Generator
Unlimited IELTS Speaking Part 1, 2, & 3 Sample Generator
Unlimited Usage Of Advanced Tools & AI Features
Priority Support within 24h (12-month plan only)

Due to the nature of our service and the provided free trials, payments are non-refundable.