Our system will evaluate the answer based on this AI-generated description.
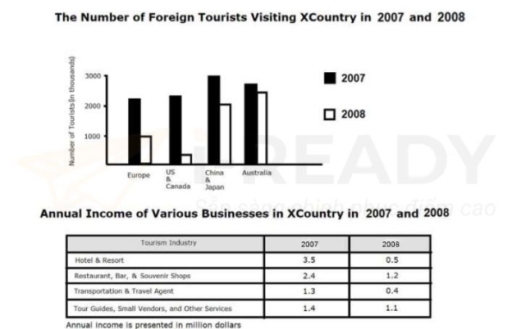
The image includes a bar graph showing the number of foreign tourists visiting XCountry from Europe, US, Canada, China, Japan, and Australia in 2007 and 2008; the numbers range from 0 to 30000 with 2007's highest number coming from Europe at just over 20000 and 2008's highest number coming from the US at just over 15000; below the graph is a table showing the annual income of various businesses in XCountry for 2007 and 2008; the tourism industry's income in 2007 included Hotel & Resort at 3.5, Restaurant, Bar, & Souvenir Shops at 2.4, Transportation & Travel Agent at 1.3, and Tour Guides, Small Vendors, and Other Services at 1.4; the same industries in 2008 saw a decrease with Hotel & Resort at 0.5, Restaurant, Bar, & Souvenir Shops at 1.2, Transportation & Travel Agent at 0.4, and Tour Guides, Small Vendors, and Other Services at 1.1; annual income is presented in million dollars.
Given the complexity of the image, the above description may not be entirely accurate.
Skyrocket your IELTS band score by 1-2 points in under a month with our premium plan!
Note: Both the topic and the answer were created by one of our users.
The bar chart shows the total number of travelers visiting Nation X from different parts of the world, and the table delineates the income of different businesses in the nation from 2007 to 2008.
Overall, the number of visitors from China and Japan consistently accounted for higher volumes, while the number from Europe was the lowest in 2007. Therefore, hotels and resorts were the most demanding of annual business income, whereas transportation and travel agents showed the least in 2019. Annual income is presented in millions of dollars.
Looking at the details, the number of tourists was 2100 in Europe, significantly lower than the number from East Asia, which was 2800 in 2007. However, there were 200 in Anglo-America, significantly lower than the number from Australia, which was 2500 in 2008.
On the other hand, the annual revenue of hotels and resorts was 3.5 million dollars, which is 2.2 million more than that of transportation and travel agents in 2019. However, restaurants, bars, and souvenir shops earned 1.2 million dollars, while tour guides, small vendors, and other services earned less than 0.1 million dollars.
Word Count: 184
