Our system will evaluate the answer based on this AI-generated description.
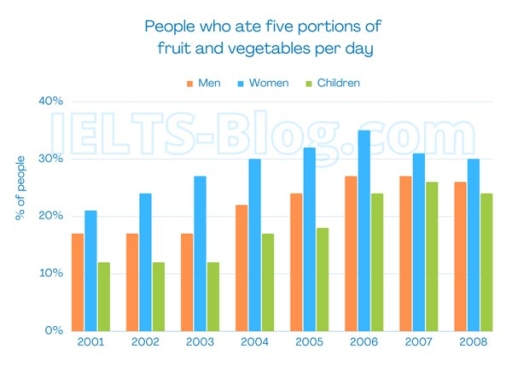
The image shows a bar chart titled "People who ate five portions of fruit and vegetables per day" with three categories: Men, Women, and Children, represented over the years 2001 to 2008. The percentage of men who ate five portions ranged from just over 20% in 2001, dipping to just below 20% in 2002, rising to about 25% in 2003, falling slightly in 2004, then increasing steadily to just over 25% in 2005, just under 30% in 2006, just over 30% in 2007, and reaching almost 35% in 2008. The percentage of women was consistently the highest, starting at just under 30% in 2001, rising to just over 30% in 2002, increasing sharply to nearly 35% in 2003, dropping slightly in 2004, then jumping to almost 40% in 2005, falling back to just over 35% in 2006, rising to nearly 40% again in 2007, and reaching 40% in 2008. The percentage of children eating five portions started at just over 10% in 2001, increased to about 15% in 2002, remained stable in 2003, rose to just over 20% in 2004, dropped back to just under 20% in 2005, increased to about 25% in 2006, remained stable in 2007, and rose to just under 30% in 2008.
Given the complexity of the image, the above description may not be entirely accurate.
Skyrocket your IELTS band score by 1-2 points in under a month with our premium plan!
Note: Both the topic and the answer were created by one of our users.
The chart shows us what percentage of people, sorted into three groups: men, women, and children, consume five servings of fruits and vegetables each day. As we can see, the lowest consumption belongs to children, and the highest one belongs to women.
It’s easy to figure out from the chart that women were trying to have a better diet from 2001 to 2006, because they were consuming more fruits and vegetables. After 2006, we can see a huge trend decline, which might be due to the financial crisis during those years.
It’s somehow surprising that men have a healthier diet than children in the UK, because men tend to eat more junk food than children. Based on the details of the chart, there is a moderate raise in consumption in the children’s and men’s groups from 2001 to 2005, but there is a huge increase rate starting from 2006 in the children’s group.
Word Count: 153
