Our system will evaluate the answer based on this AI-generated description.
The image displays a vertical bar graph that compares the percentage of people who engaged in a certain activity across three different years (2003, 2006, and 2013), with the frequency of engagement ranging from everyday to never. In 2003, the percentages were approximately 5% for every day, 15% for several times a week, 25% for once a week, 35% for once or twice a month, 20% for a few times a year, and 10% for never. In 2006, the percentages were roughly 10% for every day, 25% for several times a week, 35% for once a week, 30% for once or twice a month, 10% for a few times a year, and 5% for never. In 2013, the percentages were around 10% for every day, 30% for several times a week, 40% for once a week, 25% for once or twice a month, 15% for a few times a year, and 5% for never. The data suggests an increase in the frequency of the activity from 2003 to 2013.
Given the complexity of the image, the above description may not be entirely accurate.
Skyrocket your IELTS band score by 1-2 points in under a month with our premium plan!
Note: Both the topic and the answer were created by one of our users.
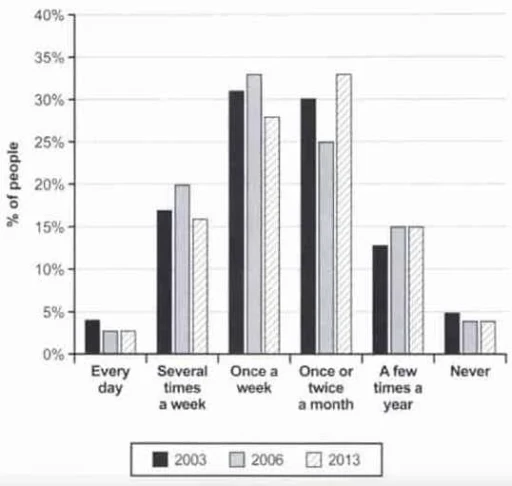
Given the chart illustrating how the frequency of eating fast foods changed from 2003 to 2013, each of them experienced different changes to some degree.
Initially, the data for those eating once a week and a few times a year shows a pronounced upward trend. As for those eating once or twice a week, it exhibited a discernible increasing trajectory, culminating in a figure of approximately 32.5% in 2013. For those who ate fast food a few times a year, an obvious upward trend was observed, marked by the ascent from about 12.5% in 2003 to 15% in 2006. Then the trend stabilized after the initial surge, suggesting a period of equilibrium.
The other four different frequencies showed completely different trajectories. In reference to those eating fast food every day and never, they experienced a discernible downward trend, decreasing from slightly less than 5% and 5% to about 2.5% and 3.5%, respectively. Then they plateaued, maintaining consistent figures of 2.5% and 3.5%. However, in terms of those eating fast food several times a week and once a week, they exhibited oscillations, peaking at 20% and about 32.5% in 2006 before retreating to slightly more than 15% and slightly more than 27%.
Word Count: 201
