Our system will evaluate the answer based on this AI-generated description.
The image contains a line graph labeled "Figure 2.1.10a: UK citrus fruit imports seasonal variation" with two lines representing "EU" and "Non EU" citrus fruit imports by the UK in 2022. The horizontal axis indicates months from January to December, and the vertical axis shows thousand tonnes from 0 to 20 in increments of 5. The "EU" line starts at approximately 15 thousand tonnes in January, dips to around 12 in February, rises to a peak near 18 in March, drops back to around 12 in April, falls gradually to just above 5 by August, then rises sharply to nearly 20 in September, before dropping back down to around 10 in December. The "Non EU" line begins at about 5 thousand tonnes in January, rises to 10 by February, maintains near 10 through May, peaks around 15 in June, decreases to 10 in July, drops sharply to nearly 0 in August, rises slightly to about 5 in September, and then fluctuates between 5 and 10 for the remaining months, ending around 5 in December.
Given the complexity of the image, the above description may not be entirely accurate.
Skyrocket your IELTS band score by 1-2 points in under a month with our premium plan!
Note: Both the topic and the answer were created by one of our users.
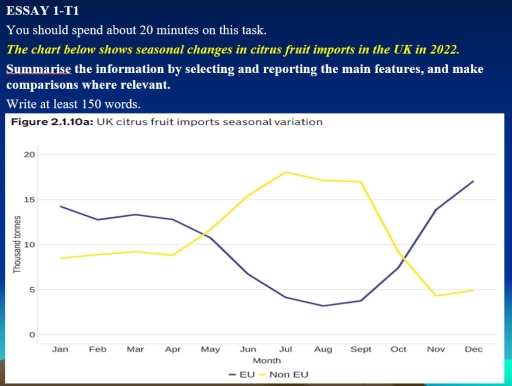
The line graph demonstrates seasonal variations in the importation of citrus crops in the UK of both the EU and non-EU throughout the year 2022.
Overall, imports from the EU exhibited a downward trend in first half of the year but then considerably increased in the last four months. In contrast, the number of non-EU imports generally followed an opposite pattern, reaching a peak in the summer and rapidly dropped toward the end of the year.
In the beginning of the year, EU imported around 14,000 tones, which was significantly higher than non-EU at about 9,000 tones. From April to Octorber, EU importations steadily declined and reached their lowest point of 3,000 tones in August. After this trough, its importations recovered sharply at about 14,00 tones, climbing back to 17,00 tones in December.
In the meantime, EU imports gradually went up during the winter whereas non-EU rose its productivities most in the summer. Notably between April and September, non-EU imports grown quickly and achieve the peak at about 18,00 tones in the July, which almost play a significant role in UK imports during the year.
Word Count: 185
