Our system will evaluate the answer based on this AI-generated description.
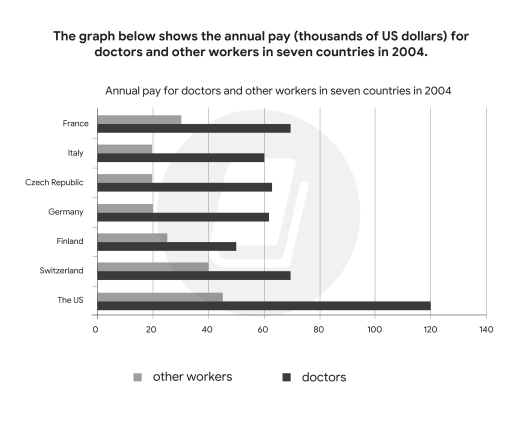
The image contains a bar graph showing the annual pay for doctors and other workers in seven countries in 2004, measured in thousands of US dollars. The countries represented are France, Italy, Czech Republic, Germany, Finland, Switzerland, and the US. In France, other workers earn just above 20, while doctors earn around 60. In Italy, other workers earn just below 20, while doctors earn around 60. The Czech Republic has other workers earning around 10, and doctors earning just above 40. Germany shows other workers earning around 20, while doctors earn over 40. Finland has other workers earning around 20, and doctors earning over 60. Switzerland displays other workers earning over 40, and doctors earning over 120. The US has other workers earning around 40, and doctors earning over 100. Two shades of bars represent the data, with lighter bars indicating other workers and darker bars indicating doctors. The x-axis is labeled from 0 to 140. The title of the graph is "Annual pay for doctors and other workers in seven countries in 2004".
Given the complexity of the image, the above description may not be entirely accurate.
Skyrocket your IELTS band score by 1-2 points in under a month with our premium plan!
Note: Both the topic and the answer were created by one of our users.
The given bar chart provides information about salaries of doctors and other workers, which was paid them annually in United States of America and six European countries namely France,Italy,Czech Republic,Germany,Finland and Switzerland in 2004. Overall,it is evident from the bar chart that the annual pay of worker demonstrated upward trend in comparison with the doctor’s salaries. A noticeable trend in the chart is the amount of remuneration of doctors and workers in the USA,which had the highest percentage among the rest six European countries.
It can be inferred from the chart that the total sum of annual salary, which paid to workers constitute roughly 25.000 dollars, while it leveled off at around of 20000 dollars in Italy,Czech Republic and Germany in comparison to Finland and Switzerland, which experienced salary policy for with the amount of around 22000 dollars and almost 40000 dollars.However this figure hit the highest point approximately 43000 dollars.
An important observation from the chart is Finland provided the lowest salary for doctor for about 45000 dollars, wheras the USA paid the highest wages annually at the amount of almost 120000 dollars.As opposed to figures of 6 enumerated countries USA still took the highest place among them.
Word Count: 199
