Our system will evaluate the answer based on this AI-generated description.
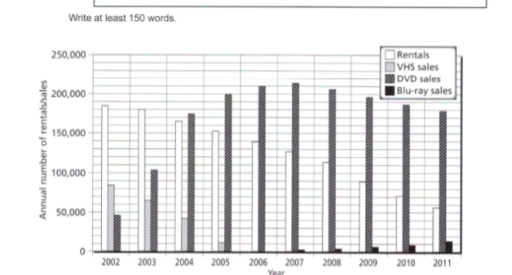
The image presents a bar graph detailing yearly data on rental, VHS sales, DVD sales, and Blu-ray sales from 2002 to 2011. In 2002, rentals reach approximately 185,000, VHS sales near 85,000, while DVD sales stand at 45,000, with Blu-ray sales absent. 2003 sees rentals at 180,000, VHS dropping to 60,000, and DVD climbing to around 95,000, Blu-ray still non-existent. 2004 rentals see a slight decline to 175,000, VHS drops further to 20,000, DVD rises further to 120,000, Blu-ray remains absent. 2005 rentals dip to 165,000, VHS sales record as zero, DVD spikes to approximately 175,000, no Blu-ray yet. 2006, rentals at 155,000, DVD sales at 200,000, still no VHS or Blu-ray. 2007 rentals barely increase to around 150,000, DVD sales peak at 215,000, Blu-ray start at 25,000. 2008, rentals slight dip to 145,000, DVD maintains 200,000, Blu-ray at approximately 60,000. 2009 rentals reduce to 140,000, DVD still at 200,000, Blu-ray increases to 75,000. 2010 rentals drop to 135,000, DVD lowers a bit under 200,000, and Blu-ray rises to nearly 110,000. 2011, rentals drop further to around 130,000, DVD slightly below the 200,000, Blu-ray peak around 125,000.
Given the complexity of the image, the above description may not be entirely accurate.
Skyrocket your IELTS band score by 1-2 points in under a month with our premium plan!
Note: Both the topic and the answer were created by one of our users.
The given chart provides information about how many rentals and sales of film in various formats were made by a particular store from 2002 to 2011
Overall ,it can be seen that there was a fluctuation in this figures of DVD sales .While the number of rentals and VHS sales had a downward trend throughout the period ,the figures for Blu-ray sales experienced a steady rise from 2008 to 2011 .Moreover,the dominance of DVDS sales and rentals OVER THE OTHER TWO CATEGORIES COULD BE OBSERVED can be remained over the other two categories
In 2002,the rentals were twice as high as VHS sales .Moreover,the rentals showed a descending trend, decreasing steadily between 150.000 and over 100.000 while the DVD sales had a dramatic surge from nearly 50.000 to over 200.000 during 4 years ,starting from 2002.Moreover ,the figure for VHS sales recorded the significant decline of 20.000 every one years to 2005 until there were no data for them .
In 2007,the Blu-ray sales stood at the lowest figure during the entire period.From 2007 to 2011,the number of DVD sales rose slightly from just over 0 to above 10.000.DVD sales and then reached over 200.000, turning this category into the top-ranking one over the given course. Despite a steady drop, DVD and rental sales remained higher than Blu-ray sales, recording approximately 180.000 and over 50,000 respectively, compared to just over 10.000 for Blu-rays in 2011
.
Word Count: 236
