Our system will evaluate the answer based on this AI-generated description.
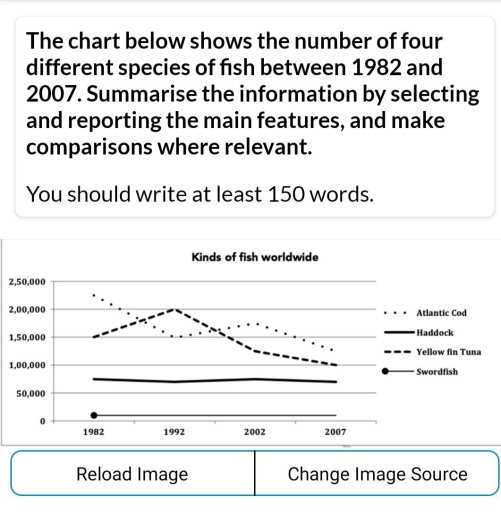
The image shows the number of Atlantic Cod, Haddock, Yellow fin Tuna, and Swordfish between 1982 and 2007: In 1982, Atlantic Cod started just below 2,00,000, Haddock just below 0.5 million, Yellow fin Tuna around 0.5 million, and Swordfish around 0. From 1987 to 1992, Atlantic Cod peaked at approximately 2.5 million, Haddock decreased to about 0.3 million, Yellow fin Tuna remained steady around 0.5 million, and Swordfish remained just above 0. From 1992 to 2002, Atlantic Cod declined steadily to around 0.5 million, Haddock fluctuated around 0.2 million, Yellow fin Tuna fluctuated around 0.5 million, and Swordfish slightly increased to just above 0. In 2007, Atlantic Cod decreased further to just below 0.5 million, Haddock continued fluctuating around 0.2 million, Yellow fin Tuna remained around 0.5 million, and Swordfish slightly increased.
Given the complexity of the image, the above description may not be entirely accurate.
Skyrocket your IELTS band score by 1-2 points in under a month with our premium plan!
Note: Both the topic and the answer were created by one of our users.
A glance at the provided line graph highlights the quantities of four distinct species of fish between 1982 and 2007.
Overall, it is noticeable that the Atlantic Cod and Yellow fin Tuna witness an downward trend. By contrast, Haddock and Swordfish are remain stable. Remarkably, the Atlantic Cod are on top of the line graph in the whole period.
Get a close view, in the first year, the Atlantic Cod started at under 250.000 and dropped significantly at 150.000 in 1992 and rise slowly then end at under 150.000 in 2007. Meanwhile, yellow fin tuna at 150.000. After that, it increasing gradually to 200.000 in the next few years, then hit the bottom at 100.000 in 2007.
Remaining cagory, the Haddock and Wordfish are stay constain in a hole line graph.
Word Count: 131
