Our system will evaluate the answer based on this AI-generated description.
The image is a vertical bar chart with years on the x-axis, from 2001 to 2008, and percentages on the y-axis, from 0 to 40% in increments of 5%. Three groups are represented in each year: children, men, and women. In 2001, children were at 20%, men at around 22%, and women at 25%. In 2002, children decreased to just above 15%, men to just under 25%, and women to just above 25%. In 2003, children increased to slightly above 20%, men decreased to about 23%, and women increased to around 27%. In 2004, children were just under 25%, men at 25%, and women at 30%. In 2005, children were around 27%, men just above 25%, and women just below 32%. In 2006, children decreased to just above 25%, men to around 23%, and women increased to 33%. In 2007, children were at 26%, men at 24%, and women at 33%. In 2008, children increased to around 27%, men decreased to around 22%, and women slightly decreased to just below 33%. There is a note at the bottom stating "Write at least 150 words."
Given the complexity of the image, the above description may not be entirely accurate.
Skyrocket your IELTS band score by 1-2 points in under a month with our premium plan!
Note: Both the topic and the answer were created by one of our users.
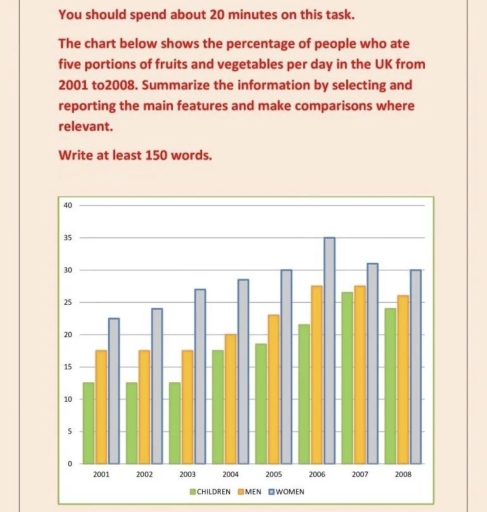
The depicted bar chart gives information on percentages of three cohorts(women, men and children) who consumed 5 portions of fruits and vegetables a day from 2001 to 2008.
Overall, it is clear that the highest percentage was shown by women, whilst children held the least rate.
Starting in 2001, the rate of 22.5% was shown by women. In 2002, the portion of females reached 24%, and in 2003 it was about 27%. In terms of men and children, both groups remained the same in the period of 2001-2003, displaying approximately 17.5% and 12.5% respectively. In 2004, all three groups went up, as it was 28% for women, 20% for men and nearly 20% for children. Next year, women stayed the highest with 30%, which is 7.5% more than males. 18% of children used to eat 5 portions a day that year. In 2006, female’s and male’s percentage were the highest across all the years(35% and 27% each), In the year 2007, women’s rate was little more than 30% and the men’s and children’s proportions were nearly the same. The very last year, the distributions were 30%, 26% and 24% for women, men and children each
Word Count: 195
