Our system will evaluate the answer based on this AI-generated description.
The image shows a bar graph with four categories: Zoo, Library, Theatre, and Cinema, with three different groups represented: Born in Australia, New migrants born in English-speaking countries, and New migrants born in other countries. For the Zoo category, Born in Australia group is around 28%, New migrants born in English-speaking countries is around 25%, and New migrants born in other countries is around 20%. For the Library category, Born in Australia group is around 45%, New migrants born in English-speaking countries is around 40%, and New migrants born in other countries is around 35%. For the Theatre category, Born in Australia group is around 25%, New migrants born in English-speaking countries is around 15%, and New migrants born in other countries is around 10%. For the Cinema category, Born in Australia group is around 65%, New migrants born in English-speaking countries is around 48%, and New migrants born in other countries is around 55%. The graph shows that the Born in Australia group consistently has a higher percentage in all categories.
Given the complexity of the image, the above description may not be entirely accurate.
Skyrocket your IELTS band score by 1-2 points in under a month with our premium plan!
Note: Both the topic and the answer were created by one of our users.
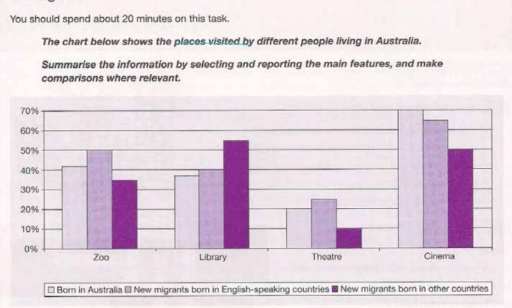
The chart compares the types of places visited by three groups of people living in Australia: those born in Australia, new migrants from English-speaking countries, and new migrants from non-English-speaking countries.
Overall, Australians born in the country visit cinemas and theaters most frequently, while new migrants from other countries show a higher preference for libraries. All three groups visit zoos and museums at similar rates, but significant differences exist in their entertainment and educational venue choices.
Australians born in the country are the most frequent visitors to cinemas and theaters, with approximately 60% attending these venues. New migrants from English-speaking countries follow closely at around 50%, while those from other countries visit these locations least often (about 35%). This suggests that cultural background influences entertainment preferences.
In contrast, new migrants from non-English-speaking countries visit libraries most frequently (nearly 55%), likely for language learning or community resources. Australians and English-speaking migrants visit libraries less often (around 40% and 30%, respectively). All three groups visit museums and zoos at similar rates (40–50%), indicating these are universally popular attractions.
Word Count: 176
