Our system will evaluate the answer based on this AI-generated description.
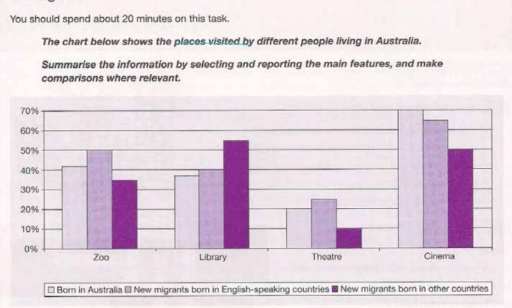
The image shows a bar graph with four categories: Zoo, Library, Theatre, and Cinema, with three different groups represented: Born in Australia, New migrants born in English-speaking countries, and New migrants born in other countries. For the Zoo category, Born in Australia group is around 28%, New migrants born in English-speaking countries is around 25%, and New migrants born in other countries is around 20%. For the Library category, Born in Australia group is around 45%, New migrants born in English-speaking countries is around 40%, and New migrants born in other countries is around 35%. For the Theatre category, Born in Australia group is around 25%, New migrants born in English-speaking countries is around 15%, and New migrants born in other countries is around 10%. For the Cinema category, Born in Australia group is around 65%, New migrants born in English-speaking countries is around 48%, and New migrants born in other countries is around 55%. The graph shows that the Born in Australia group consistently has a higher percentage in all categories.
Given the complexity of the image, the above description may not be entirely accurate.
Skyrocket your IELTS band score by 1-2 points in under a month with our premium plan!
Note: Both the topic and the answer were created by one of our users.
The bar graph illustrates the frequency of visits to recreational venues, namely Zoo, Library, Theatre, and Cinema, by three demographic groups residing in Australia.
Overall, individuals born in Australia display a higher propensity to visit all listed venues compared to the two migrant groups.
Regarding Zoo visits, around 28% of Australian-born individuals frequented this venue, slightly exceeding the 25% of migrants from English-speaking countries. Meanwhile, only 20% of non-English-speaking migrants visited the Zoo. A similar trend emerges for Library attendance, where 45% of Australian-born individuals patronized libraries, compared to 40% and 35% for migrants from English-speaking and non-English-speaking nations, respectively.
Conversely, Theatre and Cinema attendance demonstrate stark differences. Approximately 25% of Australian-born individuals attended the Theatre, notably surpassing the 15% and 10% recorded for migrants from English-speaking and non-English-speaking backgrounds. In contrast, Cinema attendance was remarkably high among Australian-born individuals at 65%, followed by 55% for non-English-speaking migrants and 48% for English-speaking migrants.
Word Count: 153
