Our system will evaluate the answer based on this AI-generated description.
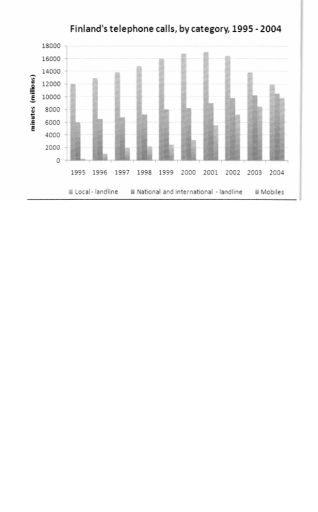
The image shows a bar chart of Finland's telephone calls (in millions of minutes) by category from 1995 to 2004. In 1995, local landline calls were 12000, national and international landline calls were 6000, and mobile calls were 2000. In 1996, local landline calls remained at 12000, national and international were 6000, and mobile calls increased to 4000. In 1997, local landline were 13000, national and international 6000, and mobile 6000. In 1998, local landline were 14000, national and international 6000, and mobile 8000. In 1999, local landline were 13000, national and international 5000, and mobile 10000. In 2000, local landline were 12000, national and international 5000, and mobile 12000. In 2001, local landline were 11000, national and international 4000, and mobile 14000. In 2002, local landline were 10000, national and international 4000, and mobile 15000. In 2003, local landline were 9000, national and international 3000, and mobile 14500. In 2004, local landline were 8000, national and international 3000, and mobile 13000.
Given the complexity of the image, the above description may not be entirely accurate.
Skyrocket your IELTS band score by 1-2 points in under a month with our premium plan!
Note: Both the topic and the answer were created by one of our users.
The bar chart compares different types of telephone calls in the UK in terms of a total number of minutes from 1995 to 2000.
Overall, while local-fixed line gained the most popularity in the UK, there was an upward trend in the number of minutes spent on three categories of phone calls.
With regard to local-fixed line, the number of minutes increased between 1995 and 1998, rising from more than 70 billion to just under 90 billion. It reached a peak of 90 billion in the following year before experiencing a drop of nearly 20 billion throughout the remainder of the period.
There was a gradual growth in the figure for national and international – fixed line during the 7-year period, from about 38 billion to approximately 61 billion shown. Similarly, mobiles saw the number of minutes go up considerably from around 3 billion in 1995 to reach the highest point of almost 45 billion in 2002. It is noticeable that the number of minutes spent on mobiles in the year 2002 was nearly three times as high as that in 1999.
Word Count: 182
