Our system will evaluate the answer based on this AI-generated description.
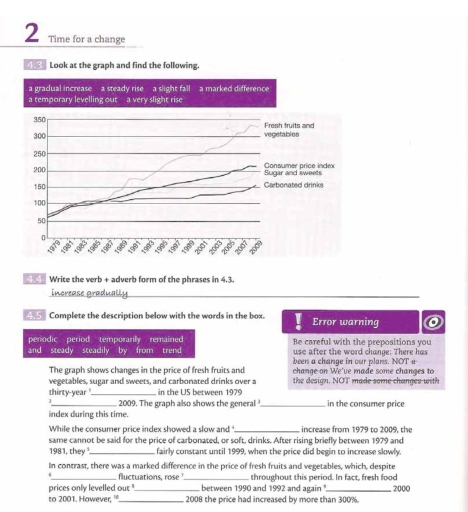
The image shows a graph displaying price changes from 1979 to 2009. Numerical values are: Fresh fruits and vegetables start just over 200 in 1979, peaking near 350 in 2009. Consumer price index begins at 100, increasing to roughly 200. Sugar and sweets start near 50, rising to about 160. Carbonated drinks start near 40, reaching around 150. Data points every five years: 1979 (Fruits/Vegetables ~210, Consumer Price ~100, Sugar/Sweets ~50, Carbonated Drinks ~40); 1984 (Fruits/Vegetables 250, Consumer 125, Sugar/Sweets 70, Carbonated Drinks 60); 1989 (Fruits/Vegetables 260, Consumer 150, Sugar/Sweets 90, Carbonated Drinks 80); 1994 (Fruits/Vegetables 270, Consumer 150, Sugar/Sweets 110, Carbonated Drinks 100); 1999 (Fruits/Vegetables 290, Consumer 170, Sugar/Sweets 120, Carbonated Drinks 110); 2004 (Fruits/Vegetables 330, Consumer 180, Sugar/Sweets 140, Carbonated Drinks 130); 2009 (Fruits/Vegetables 350, Consumer 200, Sugar/Sweets 160, Carbonated Drinks 150). The graph features periods of steady, marked differences, slight rises, and a leveling off.
Given the complexity of the image, the above description may not be entirely accurate.
Skyrocket your IELTS band score by 1-2 points in under a month with our premium plan!
Note: Both the topic and the answer were created by one of our users.
The chart shows diagram of marketing sales of products in 1979 and 2009 years.
Overall, all of these 3 products had increased until 2009. And as can be seen from the chart fresh fruits and vegetables experienced a very slight rise.
Carbonated drinks saw a steady rise since 50 until 150 sales in 1979 and 2009 years. Consumer price index sugar and sweets witnessed a temporary levelling out since 50 until 200 sales in 1979 and 2009 years. By contrast, the sales for two products had steady growth until 1987 years. But carbonated drinks continued steady rise until 150 sales, however consumer price index sugar and sweets got significant growth until around 200 sales in 2009 years. Fresh fruits and vegetables are the most increased products. According to the chart there was a considerable rise since 50 until approximately 350 sales in 1979 and 2009 years. All of these 3 products had similar steady growth until 1987 years and then there was a marked difference and other two products instead of carbonated drinks saw considerable increase , while carbonated drinks continued steadily growing.
Word Count: 183
