Our system will evaluate the answer based on this AI-generated description.
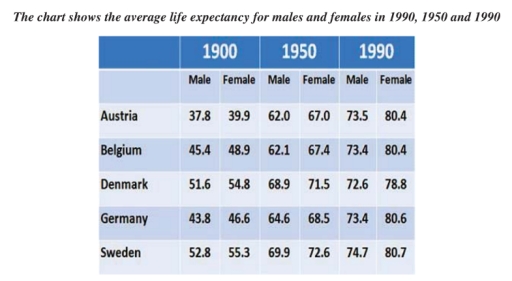
The image contains a chart with life expectancy data for males and females in Austria, Belgium, Denmark, Germany, and Sweden for the years 1900, 1950, and 1990; Austria's life expectancy for males and females in 1900 was 37.8 and 39.9, in 1950 was 62.0 and 67.0, and in 1990 was 73.5 and 80.4, respectively; Belgium's life expectancy for males and females in 1900 was 45.4 and 48.9, in 1950 was 62.1 and 67.4, and in 1990 was 73.4 and 80.4; Denmark's life expectancy for males and females in 1900 was 51.6 and 54.8, in 1950 was 68.9 and 71.5, and in 1990 was 72.6 and 78.8; Germany's life expectancy for males and females in 1900 was 43.8 and 46.6, in 1950 was 64.6 and 68.5, and in 1990 was 73.4 and 80.6; Sweden's life expectancy for males and females in 1900 was 52.8 and 55.3, in 1950 was 69.9 and 72.6, and in 1990 was 74.7 and 80.7.
Given the complexity of the image, the above description may not be entirely accurate.
Skyrocket your IELTS band score by 1-2 points in under a month with our premium plan!
Note: Both the topic and the answer were created by one of our users.
The table chart provides how the data on the average lifespan of people from Austria, Belgium, Denmark, Germany, and Sweden changed in three separate years, 1900, 1950, and 1990.
Overall, it can be seen that the average age of women was always higher than men over the period shown. Further, the Swedish people both male and female, lived longer than any other people in the given chart.
Looking at the data sets in more detail it is clear that, the life expectancy in Sweden and Denmark was the highest in 1900 and 1950 and this turned out to be the lowest for Danish people in 1990, having 72.6 (male) and 78.8 (female) however, Sweden remained on the top as before with 74.7 for male and 80.7 for female.
Turning to the remaining data set it is evident that between 1900 and 1990, the lifespan of Austrians male and female nearly doubled, rising from 37.8 to 73.5 and 39.9 to 80.4 respectively. The gap in life expectancy between people in Belgium and Germany decreased, with life expectancies reaching 73.4 years and around 80 years for males and females.
Word Count: 187
