🔥 Today Only: Save 30% on Premium — Offer Ends Soon! - Upgrade Now!
Table

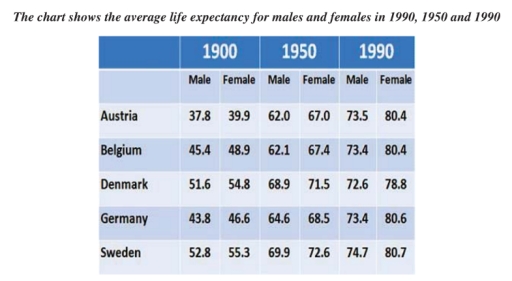
Band 4+: The chart shows the average life expectancy for males and females in 1990, 1950 and 1990

Image for topic: The chart shows the average life expectancy for males and females in 1990, 1950 and 1990
Our system will evaluate the answer based on this AI-generated description.
The image contains a chart with life expectancy data for males and females in Austria, Belgium, Denmark, Germany, and Sweden for the years 1900, 1950, and 1990; Austria's life expectancy for males and females in 1900 was 37.8 and 39.9, in 1950 was 62.0 and 67.0, and in 1990 was 73.5 and 80.4, respectively; Belgium's life expectancy for males and females in 1900 was 45.4 and 48.9, in 1950 was 62.1 and 67.4, and in 1990 was 73.4 and 80.4; Denmark's life expectancy for males and females in 1900 was 51.6 and 54.8, in 1950 was 68.9 and 71.5, and in 1990 was 72.6 and 78.8; Germany's life expectancy for males and females in 1900 was 43.8 and 46.6, in 1950 was 64.6 and 68.5, and in 1990 was 73.4 and 80.6; Sweden's life expectancy for males and females in 1900 was 52.8 and 55.3, in 1950 was 69.9 and 72.6, and in 1990 was 74.7 and 80.7.
Given the complexity of the image, the above description may not be entirely accurate.
Note: Both the topic and the answer were created by one of our users.

The chart illustrates the data about the average life expectancy for males and females in 1900, 1950 and 1990 in different countries.

overall,the highest life expectancy for males and females is in year 1990 and lowest life expectancy of male and female in year 1900 and and 1950 is in mid.

The the highest life expectancy for males and females is in year 1990 where the population of female is increased in Austria by 6.5,In Belgium the increased population is also of female by 7,In Denmark female population is slightly larger then male population by 6.2 whereas, in Germany female is leading by 7.2,In year 1990 Sweden has the lowest increased population of female which is only 6.

The mid population increased is in year 1950 there are no drastic changes in population increase rate in this year the population of female is increased rather than male the bigger growth of female is in Austria which is 6.5. and the lowest number of life expectancy is in year 1900 where the numer of female life expectancy is more then male by 3.5, and lowest life expectancy is in sweden by 0.5.

Word Count: 191

Answers On The Same Topic:

The chart shows the average life expectancy for males and females in 1990, 1950 and 1990

The table illustrates the minimum life expectancy for boys and girls in 1900,1950 and 1990. Overall ,it is explicit that boys and girls are the highest life expectancy of Sweden in all three years, while austria had the lowest life expectancy of boys and in all years. In 1900, Austria had few life expectancy rates […]

The chart shows the average life expectancy for males and females in 1990, 1950 and 1990

The chart illustrates the average life expectancy for for males and females across 5 different countries in1900, 1950 and 1990. Overall, The year 1990 demonstrates, a slight increase in the life expectancy of both genders incontrast to other years. The life expectancy of girls in 1900 and 1990 for austria, belgium, denmark, germany and sweden […]

The chart shows the average life expectancy for males and females in 1990, 1950 and 1990

The table shows the average life expectancy of males and females in five European countries in 1900, 1950 and 1990. Overall, life expectancy increased in all countries during the period. It is also clear that women lived longer than men in every country and in each year. In 1900, Sweden and Denmark had the highest […]

The chart shows the average life expectancy for males and females in 1990, 1950 and 1990

The table compares the average life expectancy of men and women in Austria, Belgium, Denmark, Germany and Sweden in 1900, 1950 and 1990. Overall, life expectancy rose dramatically in all five countries over the 90-year period. In every year shown, females lived longer than males, and the gender gap generally widened over time. In 1900, […]

See All

Other Topics:

The table below gives information about the percantage of households with different types of technology in three countries in 2020

The table illustrate and shows the information about the percentage of households with different type of technology in three different states in 2020 Overall, the table discuss 5 main technology of three different countries.Including USA,UK and JAPAN.The tecnology carings 5 components are ( Internet,Smartphones,Tables,Smart Tvs,Desktop computers ). To begin with , In JAPAN the % […]

The charts below show the percentage of people using different types of transportation in a city in 2000 and 2025.

The table depicts the percentage of individuals who used various forms of transportation to commute to work in a specific city in 2000, 2010, and 2020. Overall, the most commonly used form of transportation during the period was cars, although their usage declined. In contrast, bus usage showed an upward trend, increasing by 5 percentage […]

The charts below show the percentage of people using different types of transportation in a city in 2000 and 2025.

The table depicts the percentage of individuals who used diverse forms of transportation to commute to work in a specific city in 2000, 2010, and 2020. Overall, the most commonly used form of transportation during the period was cars, although their usage declined. In contrast, bus usage showed an upward trend, increasing by 5 percentage […]

The table shows the changes in modes of travel in a European country between 1995 and 2005. It also shows a projection to the year 2025. Summarise the information by selecting and reporting the main features and make comparisons where relevant.

The table illustrates transformations in variety kinds of transportation in Europe from 1995 to 2005 with a 20-year projection. As an overall statement, it is conspicuous that almost number of transportation type was increased in the later year except bicycle, and bus. While the rail had the highest total of users over the period, just […]

The table below gives information on the number of australian people who visited the seven most popular destinations uin 1999 and 2009.

The given table illustrates data about how many Australian people went to seven most popular destinations in a 10-year period, between 1999 and 2009. Overall, it is readly apparent that the number of visitors going to all seven destinations rose constantly. The highest increase was observed in Australian people visiting China, while the United States […]

See All
We have detected unusual activity on your device.
Please verify your identity to continue.
Note: This verification step won't sign you in. If you have a premium account, please log in to access the service as usual.
Google/Gmail Verification
Or verify using Email/Code
We've sent a verification code to:
youremail@gmail.com (Not your email?)
Enter it below to complete the verification process.
Ensure your email address is correct, your inbox is not full, and you check your spam folder. If no email arrives, consider using an alternative email.
You will need a Premium plan to perform your action!
Note: If you already have a premium account, please log in to access our services as usual.

Plans & Pricing

Our mission is to make quality education accessible for everyone.
However, to keep our hardworking team running and this service alive, we genuinely need your support!
By opting for a premium plan, not only do you sustain us in achieving the mission, but you also unlock advanced features to enrich your learning experience.

Free

For learners who aren't pressed for time

What's included on Free
100+ Cambridge IELTS Tests
Instant IELTS Writing Task 1 & 2 Evaluation (2 times/month)
Instant IELTS Speaking Part 1, 2, & 3 Evaluation (2 times/month)
Instant IELTS Writing Task 1 & 2 Essay Generator (2 times/month)
500+ Dictation & Shadowing Exercises
100+ Pronunciation Exercises
Flashcards
Other Advanced Tools

Premium

For those serious about advancing their English proficiency, and for IELTS candidates aspiring to boost their band score by 1-2 points (especially in writing & speaking) in just 30 days or less

What's included on Premium
Save Your IELTS Test Progress & Analyze Mistakes By Question Type
Save Your Own Flashcard Sets & Use Them On Any Device
Unlock All Courses, IELTS Tests, Section & Part Practice
Unlimited AI Conversations
Unlimited AI Writing Enhancement Exercises
Unlimited IELTS Writing Task 1 & 2 Evaluation
Unlimited IELTS Speaking Part 1, 2, & 3 Evaluation
Checked Answers Will Not Be Published
Unlimited IELTS Writing Task 1 & 2 Essay Generator
Unlimited IELTS Speaking Part 1, 2, & 3 Sample Generator
Unlimited Usage Of Advanced Tools & AI Features
Priority Support within 24h (12-month plan only)

Due to the nature of our service and the provided free trials, payments are non-refundable.