Our system will evaluate the answer based on this AI-generated description.
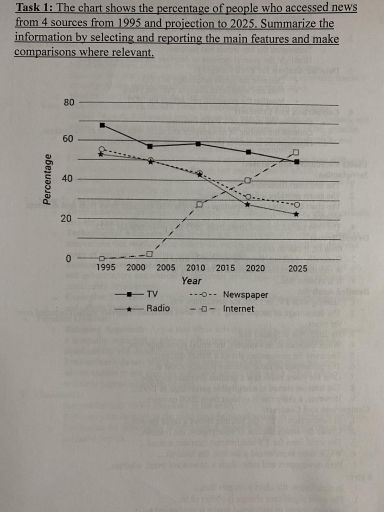
The image presents a line graph comparing the percentage of people accessing news from TV, radio, newspapers, and the internet over years 1995, 2000, 2005, 2010, 2015, 2020, and projected to 2025. For TV, the percentages start at about 72% in 1995, decline to around 68% in 2000, rebound to approximately 70% in 2005, drop to 63% in 2010, further to 58% in 2015 and about 53% in 2020, with a projected decrease to near 50% in 2025. For radio, the percentages show a decline from about 45% in 1995 to around 35% in 2000, a rise to near 40% in 2005, dropping again to approximately 32% in 2010, about 28% in 2015, and 24% in 2020, with a projection of about 21% in 2025. Newspaper readings begin at roughly 38% in 1995, decrease to near 30% in 2000, rise to about 32% in 2005, fall again to around 23% in 2010, 18% in 2015, and 13% in 2020, with an expected further decrease to around 10% in 2025. For internet, the graph starts at approximately 10% in 2000, surges to around 30% in 2005, increases to about 48% in 2010, rises further to 55% in 2015, reaching 62% in 2020, with a projection of nearing 68% in 2025.
Given the complexity of the image, the above description may not be entirely accurate.
Skyrocket your IELTS band score by 1-2 points in under a month with our premium plan!
Note: Both the topic and the answer were created by one of our users.
The line graph illustrates the changes in the proportion of date sources in four features over a 30-year period ending in 2025. Overall, it is clear that TV, radio and newspaper declined significantly where newspaper and radio were similar, albeit only usage of Internet was increased dramatically.
At the beginning of the period, consumption of newspaper and radio were rought around 55%, and users of newspaper were shortly before than radio. Year on year this decreased and ending of the time it was just under twenty percent, again newspaper was more than radio, resulting in remarkably similar percentages.
The users of Internet will grow around 58% in 2025, hence that at the out of the period this remained at zero. TV wathcers, however, decine dramatically at under a 70% in 1995, to exactly 50% in 2025, despite 2% growth in 2010. Over the next year its predicted that usage of Internet what gives informations will rise, while TV, radio and newspaper will fall.
Word Count: 163
