🔥 Today Only: Save 30% on Premium — Offer Ends Soon! - Upgrade Now!
Multiple Graphs

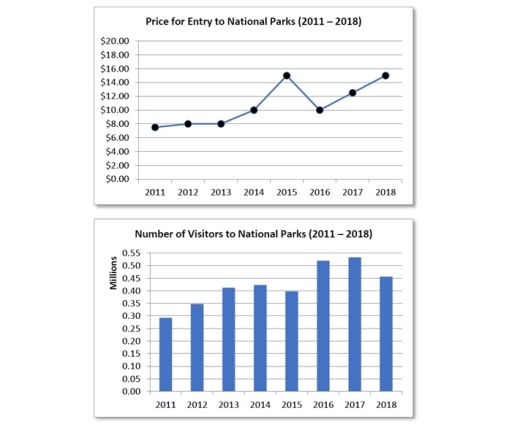
Band 8+: The charts below show changes in the cost of visiting a national park in the country from 2011 to 2018 as well as the number of visitors to national parks each year.

Image for topic: The charts below show changes in the cost of visiting a national park in the country from 2011 to 2018 as well as the number of visitors to national parks each year.
Our system will evaluate the answer based on this AI-generated description.
The image contains two graphs related to national parks from 2011 to 2018. The first graph, titled "Price for Entry to National Parks (2011 – 2018)," shows price on the y-axis, ranging from $0.00 to $20.00 in $2.00 increments, and years on the x-axis. In 2011, the entry price is at $10.00, it decreases slightly in 2012 to just below $10.00, remains steady in 2013, rises in 2014 to $12.00, stays consistent in 2015, increases in 2016 to $14.00, climbs in 2017 to $16.00, and peaks in 2018 at $18.00. The second graph titled "Number of Visitors to National Parks (2011 – 2018)," depicts the number of visitors in millions on the y-axis, ranging from 0.00 to 0.55 in 0.05 increments, and years on the x-axis. The number of visitors in 2011 is at 0.35 million, rises slightly in 2012 to just above 0.35 million, drops in 2013 to 0.30 million, increases in 2014 to 0.35 million, jumps in 2015 to 0.45 million, maintains in 2016, slightly decreases in 2017 to below 0.45 million, and remains steady in 2018.
Given the complexity of the image, the above description may not be entirely accurate.
Note: Both the topic and the answer were created by one of our users.

The line graph illustrates changes in the admission fee for national parks in a particular country between 2011 and 2018, while the bar chart shows the annual number of visitors over the same eight-year period.

Overall, both the cost of entry and the number of visitors followed an upward trajectory despite some fluctuations. Notably, visitor numbers peaked in 2017, whereas ticket prices reached their highest level in 2015 and again in 2018.

In 2011, the entry fee stood at approximately $7.50 before edging up to $8.00 in 2012, where it remained stable in 2013. After rising to $10.00 in 2014, the price surged to a peak of $15.00 in 2015. However, it dropped sharply back to $10.00 in 2016, before climbing steadily through 2017 ($12.00) to reach $15.00 once more in 2018.

Regarding attendance, roughly 0.28 million people visited national parks in 2011. This figure grew steadily over the next three years to just over 0.40 million in 2014, before dipping slightly to around 0.39 million in 2015. Visitor numbers then jumped to nearly 0.50 million in 2016 and peaked at approximately 0.52 million in 2017, followed by a modest decline to about 0.46 million in the final year.

Word Count: 199

Answers On The Same Topic:

The charts below show changes in the cost of visiting a national park in the country from 2011 to 2018 as well as the number of visitors to national parks each year.

The mentioned line graph and chart illustratrate the cost of entrance to National parks and visitors number from 2011 to 2018 respectively. Overall , the price of entrance ticket for national parks increased from $8 to $15 from 2011 to 2018 and there was some fluctuations too.The number of visitors had significantly increased from 0.28 […]

The charts below show changes in the cost of visiting a national park in the country from 2011 to 2018 as well as the number of visitors to national parks each year.

The two charts illustrate the relations between the entry fee for national parks in the country and numbers of thier visitors from 2011 to 2018. Overall, the trend regarding the numbers of tourists at the national park were corresponded with the changes in the price for entry. It could be stated that the more expentive […]

The charts below show changes in the cost of visiting a national park in the country from 2011 to 2018 as well as the number of visitors to national parks each year.

The line graphs elucidate changes in the cost of visiting a national park in the country between 2011 and 2018 as well as the number of visitors to national parks each year. Overall, the number of visitors to national parks increased steadily with some fluctuations, while the price for entry to national parks increased significantly […]

The charts below show changes in the cost of visiting a national park in the country from 2011 to 2018 as well as the number of visitors to national parks each year.

The line graph provides data on the price for entry to national parks between 2011 and 2018. While the bar chart illustrates data on the number of visitors to national parks in the same eight-year period of time. Overall, the price of visiting the national park had increased from 2011 to 2018, obtaining more visits […]

See All

Other Topics:

The charts below show the results of surveys conducted among three target groups about different aspects of a public library.

The pie charts provide the results of survey carried out between three target categories about various aspects of a public library. The figures are given in percentages. Overall, readers made up the largest proportion of respondents, while citizens accounted for the smallest percentage. In terms of library aspects, book selection received the most positive ratings, […]

The table and line charts below compare international tourist arrivals and revenue for four East Asian countries from 2000 to 2014.

The table and line chart show the difference between the incomes and numbers of tourists every two years in four countries: Thailand, South Korea, Singapore and Japan beginning from 2000 to 2014. Overall, the international tourists arrivals and its revenue in all countries increased stably and reached their peaks in the final year. Apparently, Thailand […]

The charts below show one government's spending on culture and education in 1995 and 2005 and the number of people participating in Arts events in the same years. Summarie the information by selecting and reporting the main features, and make comparisons where relevant.

The pie charts illustrate the share of money allocated to 4 different categories in a certain country over 10 years, while the bar chart represents how many people attended 4 different arts events in the same period. It is clear that the proportion of money spent on music was the highest in 1995, whereas in […]

proportional government spending on the arts number of people participating in arts events

The charts illustrate the proportion of money allocated to arts and how many people took part in them. Overall, the government spent most of its money on music in both years. Regarding the number of participants, the majority of people took part in music and theatre events. Looking first at proportional government spending on the […]

The given pie charts illustrate how dangerous waste products are treated in three different countries, including the Republic of Korea, Sweden and the United Kingdom

The provided pie charts demonstrates the means on how the three different countries, Republic of Korea, Swden and United Kingdom deal with dangerous products. Overall, both Sweden and the United kingdom prefer burying harmful waste undergroud. Unlike both, Republic of Korea leans towards recycling rather than incineration and burying. According to the United kingdom, underground […]

See All
We have detected unusual activity on your device.
Please verify your identity to continue.
Note: This verification step won't sign you in. If you have a premium account, please log in to access the service as usual.
Google/Gmail Verification
Or verify using Email/Code
We've sent a verification code to:
youremail@gmail.com (Not your email?)
Enter it below to complete the verification process.
Ensure your email address is correct, your inbox is not full, and you check your spam folder. If no email arrives, consider using an alternative email.
You will need a Premium plan to perform your action!
Note: If you already have a premium account, please log in to access our services as usual.

Plans & Pricing

Our mission is to make quality education accessible for everyone.
However, to keep our hardworking team running and this service alive, we genuinely need your support!
By opting for a premium plan, not only do you sustain us in achieving the mission, but you also unlock advanced features to enrich your learning experience.

Free

For learners who aren't pressed for time

What's included on Free
100+ Cambridge IELTS Tests
Instant IELTS Writing Task 1 & 2 Evaluation (2 times/month)
Instant IELTS Speaking Part 1, 2, & 3 Evaluation (2 times/month)
Instant IELTS Writing Task 1 & 2 Essay Generator (2 times/month)
500+ Dictation & Shadowing Exercises
100+ Pronunciation Exercises
Flashcards
Other Advanced Tools

Premium

For those serious about advancing their English proficiency, and for IELTS candidates aspiring to boost their band score by 1-2 points (especially in writing & speaking) in just 30 days or less

What's included on Premium
Save Your IELTS Test Progress & Analyze Mistakes By Question Type
Save Your Own Flashcard Sets & Use Them On Any Device
Unlock All Courses, IELTS Tests, Section & Part Practice
Unlimited AI Conversations
Unlimited AI Writing Enhancement Exercises
Unlimited IELTS Writing Task 1 & 2 Evaluation
Unlimited IELTS Speaking Part 1, 2, & 3 Evaluation
Checked Answers Will Not Be Published
Unlimited IELTS Writing Task 1 & 2 Essay Generator
Unlimited IELTS Speaking Part 1, 2, & 3 Sample Generator
Unlimited Usage Of Advanced Tools & AI Features
Priority Support within 24h (12-month plan only)

Due to the nature of our service and the provided free trials, payments are non-refundable.