Our system will evaluate the answer based on this AI-generated description.
The image displays a line graph illustrating average monthly percentage change in prices for copper, nickel, and zinc in 2014. In January, copper is at +1%, nickel at +6.5%, and zinc at +4.5%. February shows copper at 0%, nickel at +5%, and zinc at +4%. March has copper at -1%, nickel slightly above 3%, and zinc at nearly +2.5%. April records copper at -1.5%, nickel at +3.5%, and zinc at just over 1%. In May, copper stands at -2%, nickel at +2%, and zinc at a little under 1%. June figures show copper at -2.5%, nickel at +1%, and zinc slightly above 0%. In July, copper drops further to -3%, nickel dips to -1%, and zinc at -1%. August retains copper at -3%, nickel at -2.5%, and zinc at -1%. September records copper near -1%, nickel at -1.5%, and zinc marginally below 0%. October data indicates copper at 0%, nickel at -1%, and zinc at +1%. November presents copper at +0.5%, nickel at 0%, and zinc at +1.5%. December registers copper at +0.5%, nickel at nearly +1%, and zinc slightly above 2%.
Given the complexity of the image, the above description may not be entirely accurate.
Skyrocket your IELTS band score by 1-2 points in under a month with our premium plan!
Note: Both the topic and the answer were created by one of our users.
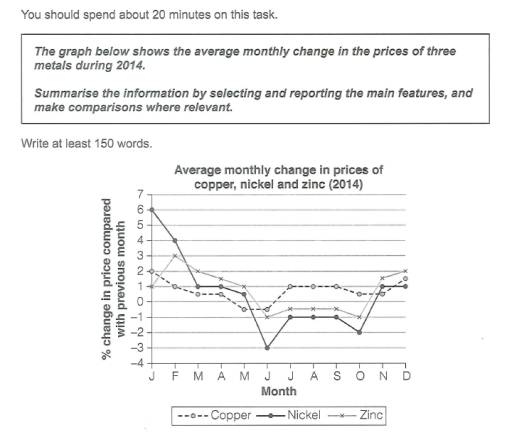
The line graph provides proportion of mean monthly changes in the prices of three metals (Cooper, Nickel, Zinc) during 2014.
Overall, it is evident that, Nickel was the highest beginning of the year, dropped to the lowest level and increased slightly, whereas Cooper and Zinc showed erratic trend over the year, in the last months all the metal prices are at the same level.
Looking at the details, in January, Nickel stood at 6 percent, after which it decline rapidly to reached 1 percent in March and fluctuated slightly and dropped to the lowest level in the month of June at -3 percent. In the second half of the year recover -2 and reached at -1, remained constant in three months. Before increased it face slightly decline in october and increased to 1 percent at final year.
Turning to the remaining categories, Cooper began at 2 percent in starting of year and decreased minimally in first half of the year at -0.5 percent in month of june, in the second half the year, it increased slightly and reached around 1.5 percent in end of the year. Similar trend can be observed for the Zinc with higher unit, in the month of february reached peak at 3 percent and remained 2 percent in the month of december.
Word Count: 216
