🔥 Today Only: Save 30% on Premium — Offer Ends Soon! - Upgrade Now!
Map

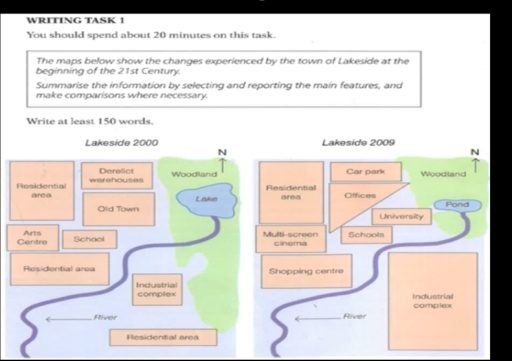
Band 6+: The diagram shows Lakeside development between years 2000 and 2009.

Image for topic: The diagram shows Lakeside development between years 2000 and 2009.
Our system will evaluate the answer based on this AI-generated description.
The image consists of two maps labeled Lakeside 2000 and Lakeside 2009, depicting changes in the town's infrastructure. In 2000, from north to south, there is a woodland, lake, old town, residential area, and river, with an arts center to the west, school to the east, industrial complex and two more residential areas to the south, and derelict warehouses to the southwest. By 2009, the northern woodland remains, but the lake is replaced by a pond, the old town becomes offices, the residential area transforms into a car park, and the school expands, with the addition of a university. The arts center becomes a multi-screen cinema, and a shopping center appears north of the southern river. The industrial complex and the southernmost residential area persist, while the central southern residential area and derelict warehouses vanish.
Given the complexity of the image, the above description may not be entirely accurate.
Note: Both the topic and the answer were created by one of our users.

The diagram illustrates the differences after a 9-year period in the town of Lakeside.

Overall, from 2000 to 2009, the town of Lakeside was industrialized and had a number of new infrastructures, which strengthened the living standards of residents.

In 2009, the space of the lake also declined considerably and became shrunk into a small pond. Additionally, approximately half of the woodland was cut down and the residential area also demolished to make way for the industrial complex to be extended significantly. Its expansion creates many economic benefits as well as reduces negative impacts on the environment.

Another striking development between 2000 and 2009 was the construction of educational institutions on the riverside. The old town was converted to offices as well as to create space conditions for school building. The derelict warehouses were redeveloped and were used to become a car park. To serve entertainment purposes as well as become more convenient for dwellers, the art center and residential area were replaced by a multi-screen cinema along with a shopping centre.

Word Count: 172

Answers On The Same Topic:

The diagram shows Lakeside development between years 2000 and 2009.

The maps illustrate the changes that took place in the town of Lakeside from 2000 to 2009. Overall, the town underwent a dramatic transformation over the period, becoming noticeably less green and more urbanized. Despite the construction of a number of new facilities, certain key features of the town remained unchanged. In 2000, Lakeside had […]

The diagram shows Lakeside development between years 2000 and 2009.

The two given maps illustrate modifications of the Lakeside area between 2000 and 2009. Overall, this area underwent extensive redevelopments, with commercial, educational and office facilities being constructed. Notably, the natural landscape was reduced in size to make way for an expansion of the industrial complex and there was a clear separation between this complex […]

The diagram shows Lakeside development between years 2000 and 2009.

The maps illustrate the development that occurred in the town of Lakeside between 2000 and 2009. Overall, it is evident that the area underwent significant changes during this period, becoming more modern with the introduction of several new buildings and facilities. In 2000, the area was relatively simple and less developed. The center of the […]

The diagram shows Lakeside development between years 2000 and 2009.

In the given maps is displayed the town of Lakeside and his 9 years transition. In the southern area of the town the industrail complex had an expansion removing completly the residential area, also with this expansion a big chunk of the woodland territory was replaced by this facilty. Considering the lake, in the northen […]

The diagram shows Lakeside development between years 2000 and 2009.

The two maps illustrate the development of the area around the lake from 2000 to 2009. Compared to the 2000 map, the 2009 map shows that the lake was reduced in size and turned into a pond, the derelict warehouses and old town were replaced by new buildings such as a university and offices, the […]

See All

Other Topics:

The maps below show a housing estate as it is now and a plan for developing it in the future.Provide an overview of the information by identifying and describing the key details, and include comparisons where appropriate.

The two maps illustrate the layout of a housing estate now and its proposed version in future. Overall the area expected to undergo a significant recreation. Much of the greenery is predicted to removed to make space for recreational areas. It is essential to highlight that the lake will be introduced. Starting with the features […]

IELTS Academic Writing Task 1 You should spend about 20 minutes on this task. The plans below show a harbour in 2000 and how it looks today. Summarise the information by selecting and reporting the main features, and make comparisons where relevant. Write at least 150 words.

The maps demonstrate changes to the Porth Harbour from 2000 to these days. Overall, it can be seen that the location of facilities underwent significant changes and the number of roads increased. Additionally, docks in the port were expanded. According to the maps, we can see that the castle was reconstructed to the hotel, and […]

the plans below show a student accommodation building in 2010 and now. Summarise the information by selecting and reporting the main features and make comparisons where relevant.

The plans illustrate how the student accommodation building has changed since 2010. Overall, the building has undergone a number of changes, the most striking of which were the addition of bedrooms and a car park at the expense of the living room. These changes have transformed the building into a place with less communal space. […]

The maps show the changes in Shalton village from 1910 to 2010. Summarise the information by selecting and reporting the main features and make comparisons where relevant

These maps demonstrates the major changes in village of Shalton between 1910 and 2010. Overall, between 1910 and 2010 the first visual change was removed the plants like trees. For addition, in 2010 more and more houses have built, but several buildings saved. In early 19th centuries trees added a colorful view inside the street […]

The map below shows the changes that have taken place in Meadowside village and Fonton a neighbouring town since 1962. Summarise the information given in the map in your words. Write at least 150 words.

The three given maps illustrate changes which happened in Meadowside and Fonton village over the period in 1962,1985 and at present. Overall, the infrastructure of villages expanded and transformed into suburbs from rural areas. Moreover there was huge renovation works. At the beginning of the year, Medowside village had only one road and compact area […]

The diagrams below show an arts centre today and how it will look after redevelopment. Summarise the information by selecting and reporting the main features, and make comparisons where relevant.

The map chart demonstrate an art centre now and after the redevelopment. Overall, It can be seen that performance area become large after development while car parking holds small space. It is clear that performance area that is in box shape that stand with 60 seats after development it become nearly twice a large and […]

See All
We have detected unusual activity on your device.
Please verify your identity to continue.
Note: This verification step won't sign you in. If you have a premium account, please log in to access the service as usual.
Google/Gmail Verification
Or verify using Email/Code
We've sent a verification code to:
youremail@gmail.com (Not your email?)
Enter it below to complete the verification process.
Ensure your email address is correct, your inbox is not full, and you check your spam folder. If no email arrives, consider using an alternative email.
You will need a Premium plan to perform your action!
Note: If you already have a premium account, please log in to access our services as usual.

Plans & Pricing

Our mission is to make quality education accessible for everyone.
However, to keep our hardworking team running and this service alive, we genuinely need your support!
By opting for a premium plan, not only do you sustain us in achieving the mission, but you also unlock advanced features to enrich your learning experience.

Free

For learners who aren't pressed for time

What's included on Free
100+ Cambridge IELTS Tests
Instant IELTS Writing Task 1 & 2 Evaluation (2 times/month)
Instant IELTS Speaking Part 1, 2, & 3 Evaluation (2 times/month)
Instant IELTS Writing Task 1 & 2 Essay Generator (2 times/month)
500+ Dictation & Shadowing Exercises
100+ Pronunciation Exercises
Flashcards
Other Advanced Tools

Premium

For those serious about advancing their English proficiency, and for IELTS candidates aspiring to boost their band score by 1-2 points (especially in writing & speaking) in just 30 days or less

What's included on Premium
Save Your IELTS Test Progress & Analyze Mistakes By Question Type
Save Your Own Flashcard Sets & Use Them On Any Device
Unlock All Courses, IELTS Tests, Section & Part Practice
Unlimited AI Conversations
Unlimited AI Writing Enhancement Exercises
Unlimited IELTS Writing Task 1 & 2 Evaluation
Unlimited IELTS Speaking Part 1, 2, & 3 Evaluation
Checked Answers Will Not Be Published
Unlimited IELTS Writing Task 1 & 2 Essay Generator
Unlimited IELTS Speaking Part 1, 2, & 3 Sample Generator
Unlimited Usage Of Advanced Tools & AI Features
Priority Support within 24h (12-month plan only)

Due to the nature of our service and the provided free trials, payments are non-refundable.