Our system will evaluate the answer based on this AI-generated description.
The image shows trade in goods and services, percentage of regional GDP, from 1970 to 2006 across various regions: Sub-Saharan Africa, CEE & CIS, Developing Asia, Middle East and North Africa, Latin America, and Advanced Economies. In 1970, Sub-Saharan Africa is at ~30%, CEE & CIS at ~40%, Developing Asia at ~10%, Middle East and North Africa at ~30%, Latin America at ~20%, and Advanced Economies at ~35%. By 1980, Sub-Saharan Africa slightly increases to ~35%, CEE & CIS rises to ~45%, Developing Asia grows to ~20%, Middle East and North Africa peaks sharply over 110%, Latin America remains ~20%, and Advanced Economies reach ~40%. In 1990, figures show Sub-Saharan Africa at ~60%, CEE & CIS nearly stable at ~45%, Developing Asia at ~43%, Middle East and North Africa decreasing to ~60%, Latin America ~32%, and Advanced Economies at ~40%. At 2000, Sub-Saharan Africa hovers around ~55%, CEE & CIS ~55%, Developing Asia ~60%, Middle East and North Africa ~80%, Latin America ~42%, and Advanced Economies ~50%. In 2006, Sub-Saharan Africa slightly above ~60%, CEE & CIS reaches ~65%, Developing Asia ~90%, Middle East and North Africa slightly over ~80%, Latin America ~50%, and Advanced Economies at ~60%.
Given the complexity of the image, the above description may not be entirely accurate.
Skyrocket your IELTS band score by 1-2 points in under a month with our premium plan!
Note: Both the topic and the answer were created by one of our users.
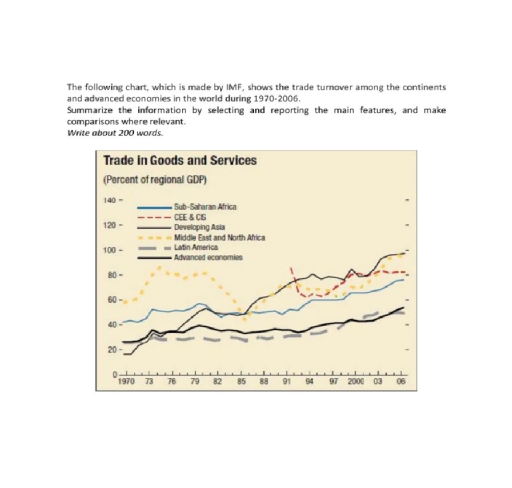
The line graph, provided by the IMF, illustrates the volume of trade transactions among continents and developed economies worldwide between 1970 and 2006.
Overall, it is evident that trade turnover increased significantly in most regions, with Central and Eastern Europe (CEE), the Commonwealth of Independent States (CIS), and Developing Asia experiencing the most dramatic growth. In contrast, Sub-Saharan Africa and Latin America maintained relatively lower and more stable levels of trade.
At the beginning of the period, the Middle East and North Africa had the highest trade turnover, peaking at around 80% of regional GDP by the mid-1970s. However, this figure fluctuated and gradually declined in the following decades. Conversely, there was a sharp rise in trade in the CEE & CIS region from the late 1980s, surpassing 80% by the early 2000s.
Developing Asia also displayed a steady upward trend, increasing from around 20% in 1970 to nearly 100% by 2006. Meanwhile, Sub-Saharan Africa and Latin America remained below 50% throughout the period. In comparison,advanced economies experienced slow but consistent growth, reaching around 50% by the end of the timeframe.
Word Count: 181
