Our system will evaluate the answer based on this AI-generated description.
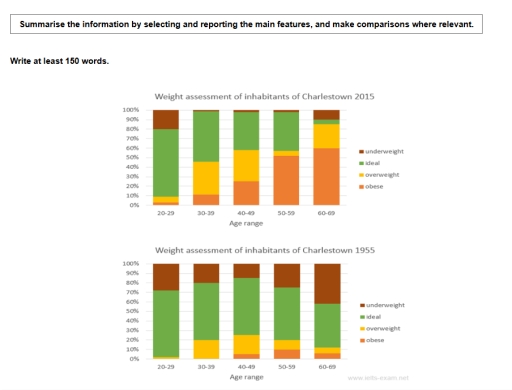
The image displays two stacked bar charts titled "Weight assessment of inhabitants of Charlestown 2015" and "Weight assessment of inhabitants of Charlestown 1955", both sharing the y-axis (0% to 100% in 10% increments), x-axis labeled "Age range" with groups "20-29", "30-39", "40-49", "50-59", and "60-69", and legends containing categories "underweight", "ideal", "overweight", and "obese". For 2015, the approximate breakdown across age groups is: 20-29: obese ~2%, overweight ~7%, ideal ~71%, underweight ~20%; 30-39: obese ~10%, overweight ~35%, ideal ~53%, underweight ~2%; 40-49: obese ~25%, overweight ~32%, ideal ~40%, underweight ~3%; 50-59: obese ~51%, overweight ~5%, ideal ~41%, underweight ~3%; 60-69: obese ~60%, overweight ~25%, ideal ~5%, underweight ~10%. For 1955, the breakdown is: 20-29: obese 0%, overweight ~2%, ideal ~70%, underweight ~28%; 30-39: obese 0%, overweight ~20%, ideal ~60%, underweight ~20%; 40-49: obese ~2%, overweight ~23%, ideal ~60%, underweight ~15%; 50-59: obese ~9%, overweight ~11%, ideal ~55%, underweight ~25%; 60-69: obese ~6%, overweight ~6%, ideal ~45%, underweight ~43%.
Given the complexity of the image, the above description may not be entirely accurate.
Skyrocket your IELTS band score by 1-2 points in under a month with our premium plan!
Note: Both the topic and the answer were created by one of our users.
The presented charts illustrate the changes in weight assessment of inhabitants of Charlestown in five groups with different age range between 1955 and 2015.
Overall, it is clear that the weight of citizens in Charlestown in 1955 were commonly lighter than that in 2015, which is corresponding to the different level of economics.
As seen, in 1955, almost more than 50% of inhabitants in each group owned an ideal weight, with the highest proportion reaching rough 70%. In addition, underweight existed in every group to some degree in 1955, ranging from about 15% to around 42%. However, overweight and obese were rare at that time which was mainly occurs in group 40-49, standing at above 25%.
In contrast, according to 2015, with the development of economics, the persentage of underweight saw a significant decline that the highest figure in group 20-29 was only almost 20%. Furthermore, overweight and obese became common in 2015 especially in group 60-69, accouting for around 85%. However, the youth (group 20-29) prefer to own an ideal weight with about 70%.
Word Count: 175
