Our system will evaluate the answer based on this AI-generated description.
The image is a line graph titled "Visits to two new music sites on the web," with the x-axis labeled "Days" marking a time range from 1 to 15 and the y-axis labeled "'000s" reporting visits in thousands from 0 to 180. Two lines track visits to "Music Choice" and "Pop Parade" across the 15 days. Music Choice starts at around 120,000 visits on Day 1, fluctuates between approximately 40,000 and 80,000 visits from Day 2 to Day 9, spikes to about 140,000 on Day 10, drops to around 100,000 on Day 11, jumps to nearly 160,000 on Day 12, then declines to roughly 60,000 on Day 13 before recovering to 120,000 on Day 14 and finishing at just under 140,000 by Day 15. Pop Parade begins close to 80,000 visits on Day 1, experiences ups and downs reaching a low near 20,000 on Day 5 and highs around 100,000 on Days 7 and 10, sharply increases to above 160,000 visits on Day 11, plummets to approximately 80,000 on Day 12, climbs again past 160,000 by Day 13, and concludes the period with a decline to about 140,000 visits on Day 15.
Given the complexity of the image, the above description may not be entirely accurate.
Skyrocket your IELTS band score by 1-2 points in under a month with our premium plan!
Note: Both the topic and the answer were created by one of our users.
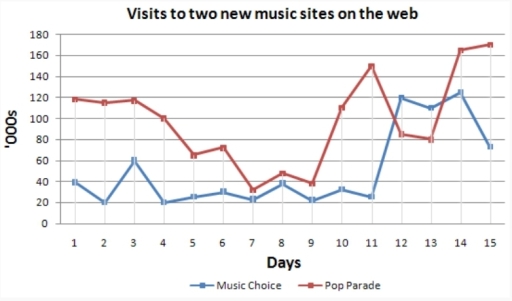
The line graph shows the comparison between the number of visits to two recently launched music websites on the internet.
Overall, both music choice and pop parade increased throughout the period with considerable fluctuations.
Music choice stood at 120.000’s in its first day and continued around this number in its following two days. It experienced a dramatic fall with the deep point of nearly 30.000’s visits in a week, before saw enormous increase, reaching to approximately 150.000 visits in the 11 day. By following music choice fell to around 80.000’s in the 12 and 13 days before resurgence in 15 day, growing to about 170.000 visits.
In the first day pop parade had 40.000 visits, this increased by 50%, reaching to 60.000’s. This number observed mild fluctuations in the next days between 20.000 and 40.000 visits. In 12 day the number of visits rised significantly to 120.000 and in the 14 day climbed its high point just over 120.000’s. However, this number returned to just under 80.000 in 15 day. 12 and 13 days were the only days music choice’s levels of visits exceeded pop parade’s, with values of around 120.000 and around 80.000, respectively.
Word Count: 195
