Our system will evaluate the answer based on this AI-generated description.
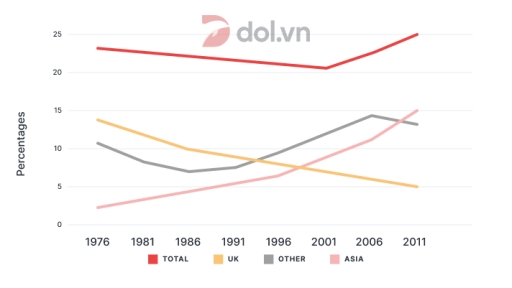
The image displays a line graph with four lines representing TOTAL, UK, OTHER, and ASIA over the years 1976, 1981, 1986, 1991, 1996, 2001, 2006, and 2011. The TOTAL line starts at approximately 5% in 1976, rises to about 10% by 1986, and continues to increase to approximately 11% in 1991, approximately 14% in 2001, and reaching around 22% by 2011. The UK line starts around 7% in 1976, drops to just under 5% by 1986, fluctuates up to around 9% by 1991, falls to about 6% in 2001, and then rises slightly to about 7% in 2011. The OTHER line starts from about 5% in 1976, rises to around 12% in 1986, peaks at around 17% in 1991, falls to about 14% in 1996, dropping further to about 9% in 2006 and rising slightly to around 11% in 2011. The ASIA line begins at around 2% in 1976, remains stable till 1981, then rises gradually to about 4% in 2006, and increases sharply to about 11% in 2011.
Given the complexity of the image, the above description may not be entirely accurate.
Skyrocket your IELTS band score by 1-2 points in under a month with our premium plan!
Note: Both the topic and the answer were created by one of our users.
The line graph illustates the proportion of Australian people who came from different places in the world like Asia, the UK, and others from 1976 to 2011.
Overall, the percentage of Australian people who belonged to the total, Asia, and other regions showed a upward trend while the opposite trend occurred among British data during the period shown.
In 1976, the proportion of Australian residents who were born in the UK account for 14% whereas the lowest percentage belonged to that of Asia. In the beginning year, the percentage of Asian immigrating to the british was roughly 4% and then rose dramatically to 15%.
In contrast, the figure for people from UK was 14% and declined significantly to 5% in 2011.
In the starting year, there was a slight increase in the total proportion of foreign-born residents with 25% in 2011. Other regions also experienced a gradual increase, rising from around 6% in 1976 to 15% in 2011.
Word Count: 158
