Our system will evaluate the answer based on this AI-generated description.
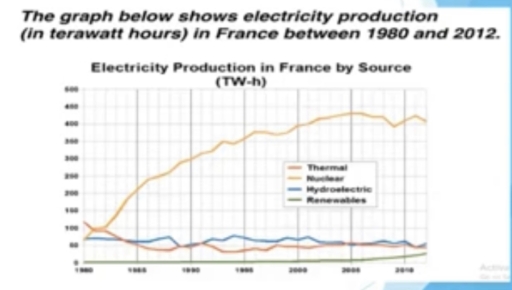
The image displays a line graph tracking electricity production in France from 1980 to 2012 measured in terawatt hours (TW-h) by source: Thermal, Nuclear, Hydroelectric, Renewables. In 1980, thermal 100 TW-h, nuclear slightly above 50, hydroelectric approximately 60, renewables negligible; 1985, thermal increased to 125, nuclear jumps to 225, hydroelectric steady at 60, renewables still minimal; 1990, thermal 150, nuclear nearing 400, hydroelectric 65, renewables around 5; 1995, thermal 175, nuclear over 400, hydroelectric 75, renewables at 10; 2000, thermal drops below 150, nuclear peaks around 425, hydroelectric 75, renewables climb to 15; 2005, thermal reduced to 100, nuclear crosses 450, hydroelectric 70, renewables reach nearly 20; 2012, thermal below 100, nuclear slightly below 450, hydroelectric approximately 65, renewables increase to 25.
Given the complexity of the image, the above description may not be entirely accurate.
Skyrocket your IELTS band score by 1-2 points in under a month with our premium plan!
Note: Both the topic and the answer were created by one of our users.
The line graph illustrates the amount the of electricity produced in france by a four sources in a specific period time in a form terawatt hours.
Overall, nuclear power was the dominant source in france during the given time. In the other hand renewables produces were almost negligible.
Looking specifically at the numbers, there is a striking similaritie between the production of thermal and hydroelectric . Starting from the same point and ending up approximately in the same place with a similar states in the time mentioned.
From the outset, there was a dramatically gap between the nuclear outcomes and the others by a ratio seven to one. In summary the highest production was occupied by the nuclears accounting for about 400 terawatt
Word Count: 123
