Our system will evaluate the answer based on this AI-generated description.
The image presents a line graph with x-axis representing years with 1980s, 1990s, 2000s, 2010s and y-axis representing percentages from 0% to 80% with intervals of 10%. Five lines depict percentages as follows: Reading starts at approximately 30% in the 1980s, falls to 20% in the 1990s, slightly decreases to just below 20% in the 2000s, and rises back to 20% in the 2010s; Hiking begins at approximately 25% in the 1980s, dips to 10% in the 1990s, climbs to 30% in the 2000s, and peaks at around 35% in the 2010s; Theatre starts at approximately 15% in the 1980s, increases to 20% in the 1990s, jumps to 35% in the 2000s, and drops sharply to 25% in the 2010s; Watching TV begins at nearly 80% in the 1980s, slightly decreases to 75% in the 1990s, falls steeply to 30% in the 2000s, and declines further to 25% in the 2010s; Surfing the Internet is introduced in the 2000s starting at around 40% and surges up to nearly 80% in the 2010s. No specific numerical percentages are provided on the graph for individual years.
Given the complexity of the image, the above description may not be entirely accurate.
Skyrocket your IELTS band score by 1-2 points in under a month with our premium plan!
Note: Both the topic and the answer were created by one of our users.
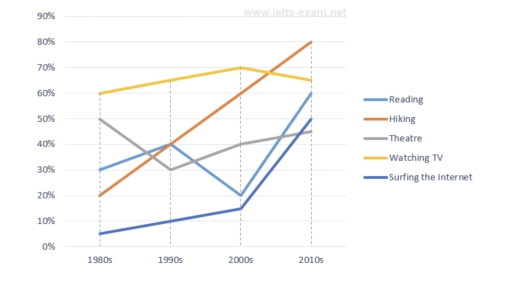
The line graph illustrates the proportion of United States older people spending their leisure time from 1980 to 2010. Overall, during this given period, hiking was the highest rate in 2010, whereas surfing the internet was the smallest to end of the year, while others were fluctuating over all years.
In detail, in the 1980s, watching TV had 60% with highly preferable interests, and it was slightly increased to 70% in 2000s. Then it slowly dropped to 20% by 65%. However, hiking was begun at 20% with least, but after that, it consistently rose up to 2010s with the highest percentage of 80%. Surfing the internet was the least compared to others with 5%, and it steadily grew with 15% in 2000s, but within one decade, it dramatically increased with 50% in 2010s.
In general, theatre and reading were facing a fluctuation period over four decades. Theatre was started with 50%, but it sharply decreased up to 1990s by 20%. After the 1990s, it slightly grew into 2010s until it reached the percentage by 45%. Although, reading began at 30% and increased up to 1990s by 10% and again dropped in 2000s by 20%, and after that, it surged to 2010s by 20%.
Word Count: 203
